UDP Counters
1. Selection: a month of daily UDP traffic from/to a given host
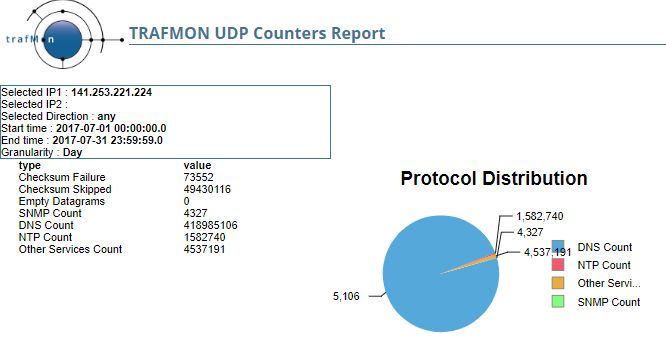
In this example, the requested report covers all observed ingress/egress UDP datagrams with a given host (141.253.221.224, direction “any“) from the first to last day of a month (July 2017), as seen by a given probe port (trafmon-loc-prb-dmz:p2p1)

2. High level UDP Counters
The High level UDP Counters report section shows the cummulated udp packets statistics over the given time span.

2. Evolution Counters
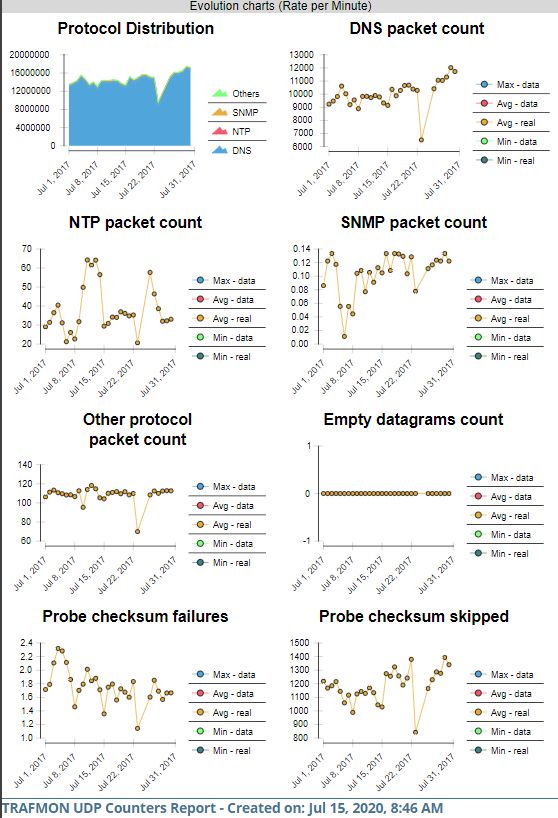
The UDP evolution counters report section shows the stacked evolution chart of the respective volumes of UDP based service protocols as well as their individual per-service evolution plot. It also shows the chart of potential occurrences of datagram with empty payload. Finally it depicts UDP checksum-related observations.

