Two way Delays
The Two way Delays report shows the round trip time taken by corresponding transaction packets (e.g. a request and its response) as measured at a given probe monitoring port.
For some kind of transactions (e.g. TCP exchanges or NTP regular polls), two round trip delays can be measured, respectively between the probe and the server (responder) as well as between the probe and the requester (initiator or client). In both cases it includes the server think time or the client inter-request waiting time. Typically, only one of the two figures is meaningful: that corresponding to the remote end system, distant from the probe port.
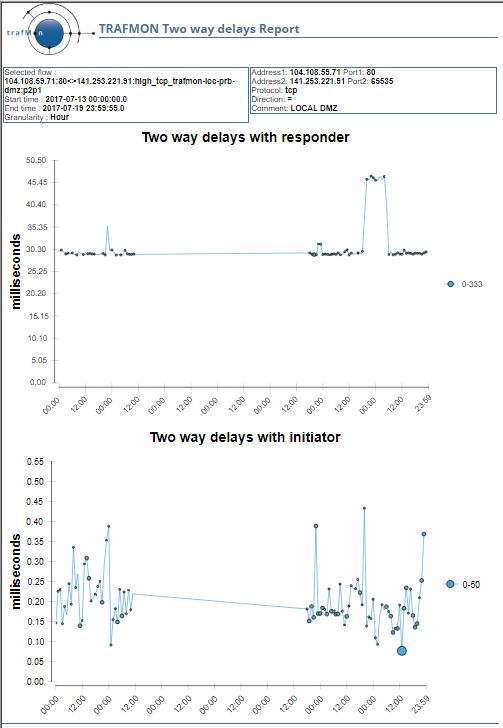
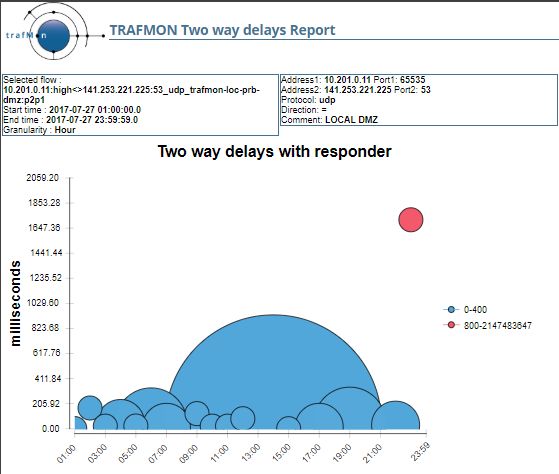
The use of a 3-dimensional bubble chart permits to depict the evolution of the distribution histogram. The size of each bubble is proportional to the population of the corresponding observed sample: how many observations give a delay that fall inside the specific interval of measured values. In the below example, all values fall inside the same interval (up to 333 ms or up to 50 ms respecively).
The center of a bubble is placed at the average among all observations pertaining to the bubble.
Some bubbles are relatively so small that they is not visible at all. Hence a broken line connects the successive bubble centers, made visible at the line breaking points.

But this representation can be misleading in case of relatively stable metric (see below). Anyway this example report can be further customized, e.g. as done for the one-way latency plot, with complementary single line chart and/or table of values.

