Fundamentals
Precise and Efficient Measurement of Individual Data Flows in Each Direction
The initial idea for the trafMon monitoring system is quite simple:
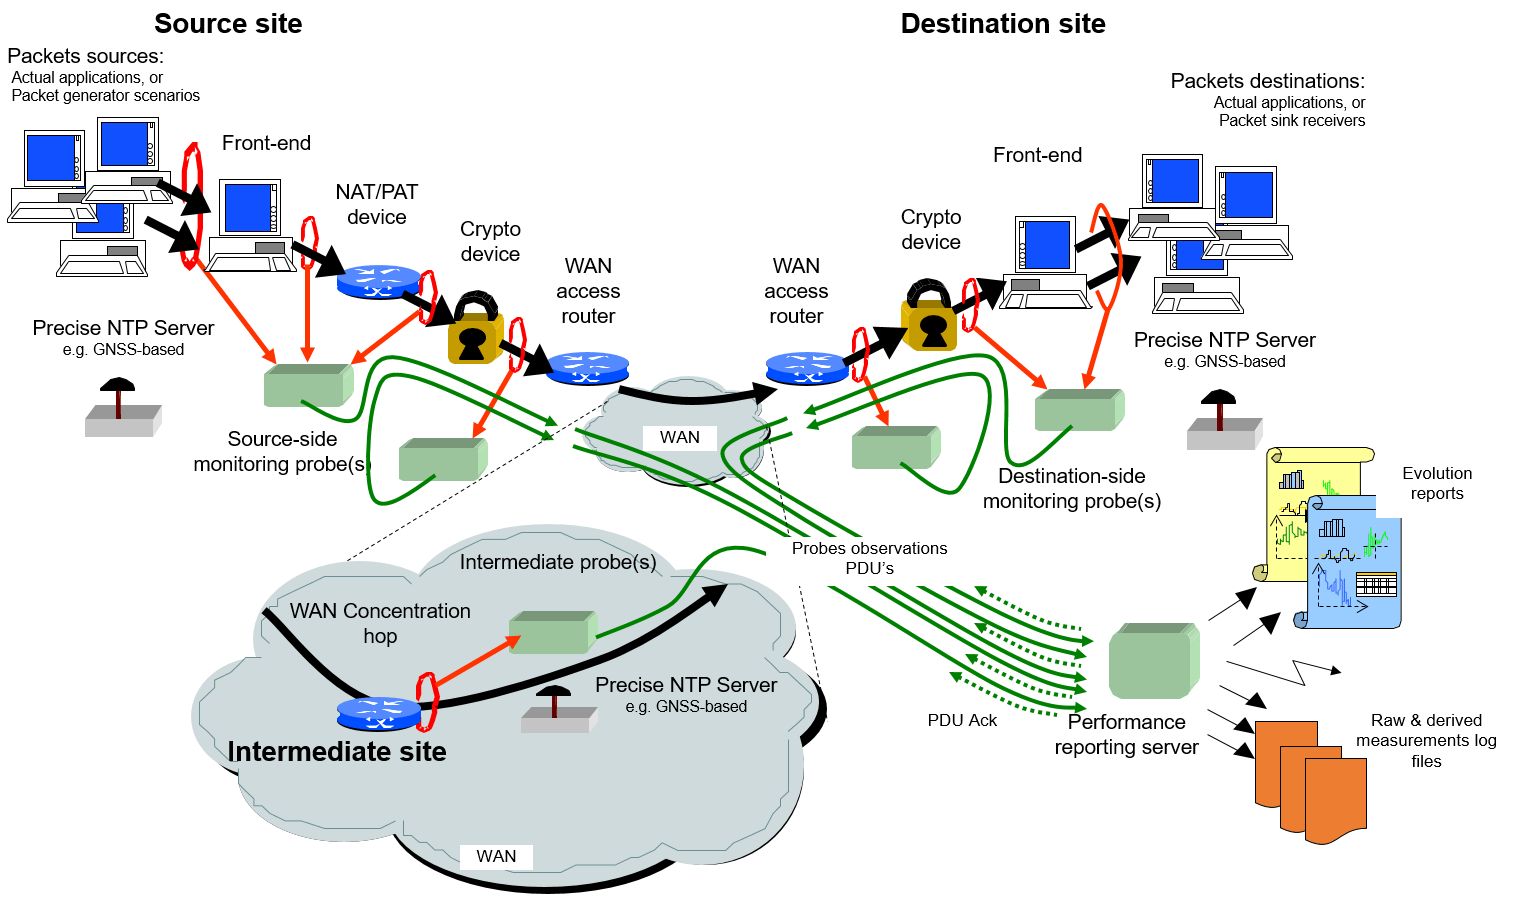
Several Network Probes are installed at two or more locations along the network path of the data-link that is to be qualified or monitored.
Typically, one probe will be at the traffic source, one at the traffic destination, and intermediate probes may be inserted at locations where the network characteristics change, or the traffic passes from one service provider to another (e.g. if the path includes a VSAT link, probes could be inserted at the Earth stations in order to differentiate problems on the satellite links from problems on the terrestrial tails).

These probes capture each packet passing along the data-link, and record the time the packet was seen by the probe.
It is even possible to place probes at intermediate points along the packet travelling path over the network, and even on alternative routes, for measuring latencies over successive segments:

These records (in the following called ‘observations’) are sent to one (or more) central system in a very compact way (< 1% of the measured traffic).
The central collector process, receiving the observations from all the probes, consolidates the received per-packet records, and calculates the time for each packet to traverse the network distance between the successive probes. Lost packets can also be detected, and pinpointing between which probes they were lost. Any data injected into the path but not originating from the expected source can also be detected.
Consolidated (raw) data and computed time delays are then stored into a centralised database.
Full-Stack Protocol Analysis and Measurement of Stateful Communications up to Application Layer
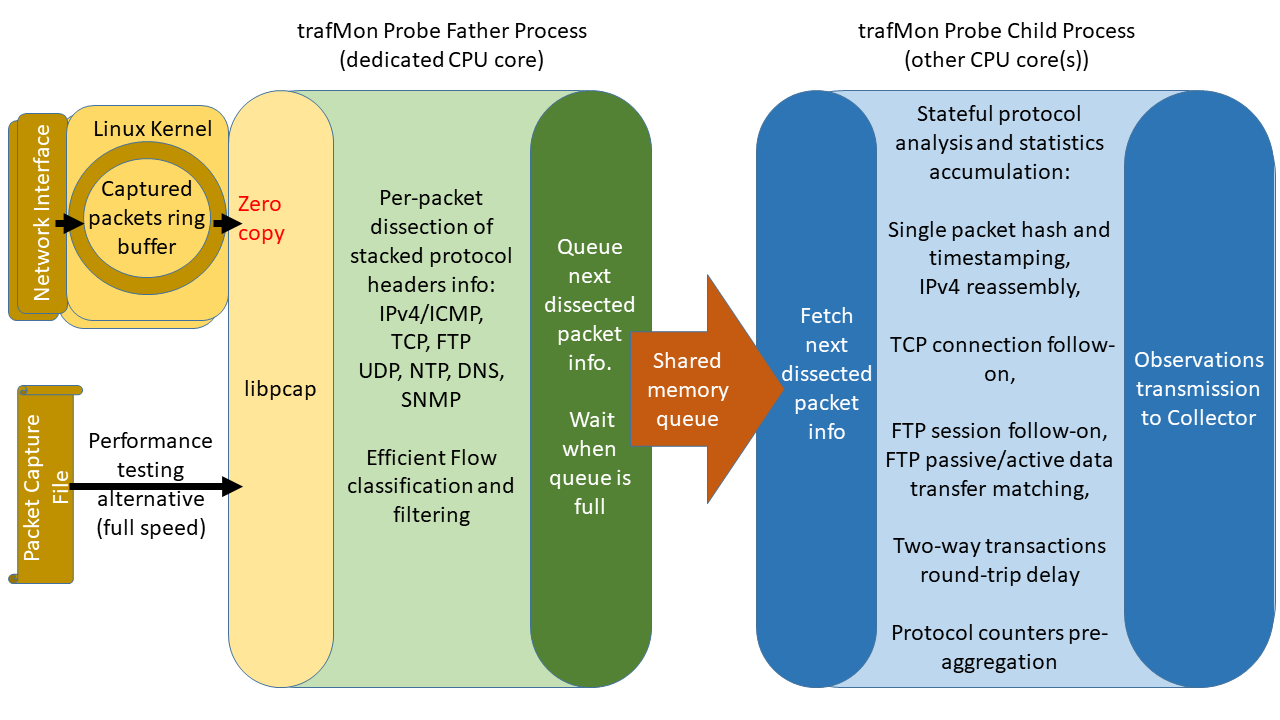
In a second stage, the probe data processing has been turned from simple handling of individual packets into a rich pipeline of full-stack protocol decoding and stateful follow-on of bi-directional communication exchanges.
The probe is currently able to analyse, at wire-speed, IPv4 and ICMPv4 behaviours, but also UDP-based transactions such as DNS, SNMP, and NTP exchanges, and even more complex TCP connections, with their adaptive window size and potential retransmissions, up to FTP control sessions and their associated file transfer data connections.

Hence the trafMon analysis is able to produce a full spectrum of measurements, from any single packet loss and one-way latency of selected data flows, to round-trip delay of two-way transactions, to detailed behaviour, payload volume, retransmissions and protocol overhead for every TCP connection, up to username, filename, size, mode/type … of every FTP file transfer.
All these raw observations are regularly bulk loaded in the relational database and counters are updated at 1 minute, 1 hour and 1 day granularity. Measurements of passive data transfers are mapped to their original FTP flows.
Classification of Traffic Volumes based on Structure and Topology of Corporate Network
Every Organisation distributes its private/public IP addresses over (virtual) servers and LAN segments assigned to specific activities (being Business Units, Departments, Projects …) and placed at different locations (sites, buildings, rooms ….). The Corporate network supports both internal communications between those conveniently defined groups, but also with external stakeholders, typically over the Internet, that can be grouped per Country (or even per City).
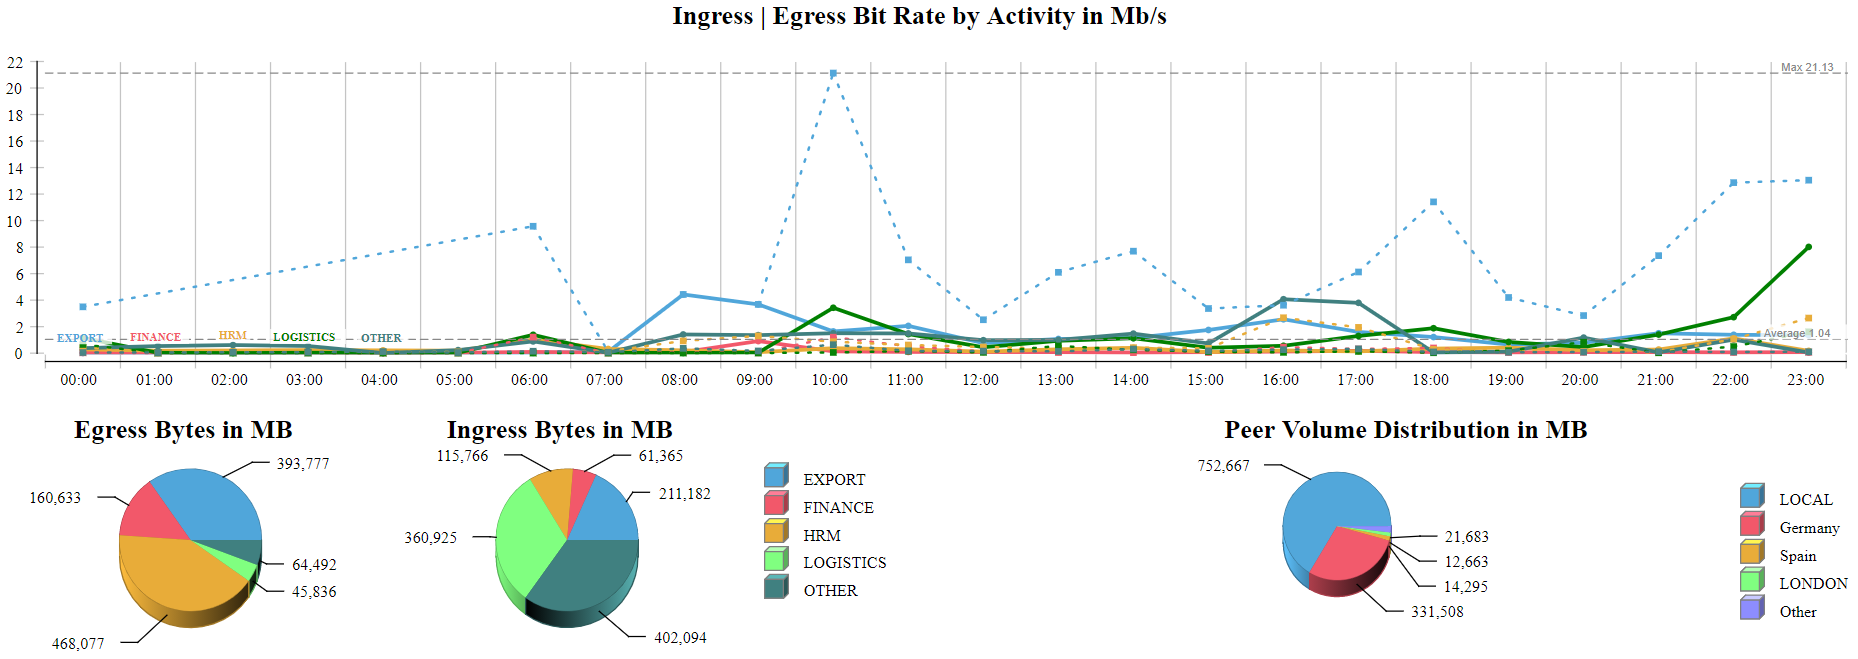
One of the observations made by the trafMon probes is the volume of traffic in each direction for every discovered data flow. This information can even be complemented with NetFlow or similar records provided by the network devices themselves.
Through custom-driven aggregation of the measured amounts of flow traffic, the trafMon reporting tool permits to browse through figures highlighting the production and consumption of data, and their evolution over time, per activity, per location, or both, and showing internal and external peers.

Customisable Generation of Graphical Reports
A Reporting System reads the database, and displays time-base charts, histograms, graphs and tables with lost packets or ‘injected’ packets, and other relevant reporting and alerting features.
trafMon is delivered with a set of predefined report templates, both for summarising the distribution of volumes over entities and over time, and for digging down to every item of detailed observations made about the layers of communication protocols. These reports can be tuned or complemented by custom-designed ones exploiting raw and aggregated information kept in relational database.
Operational functions
The trafMon software is conceptually split in two parts:
- Online functions: corresponding software is in charge of real-time and near real-time monitoring of the traffic and of producing the basic performance observations.
- One or more probes are reading (capturing in read-only stealth mode) the operational traffic
- The probe or probes are sending their observations through custom formatted UDP packets that are forwarded through their computer dedicated data port
- The collector receives the probe’s observations and sends back PDU acknowledges
- The collector regularly outputs the basic observations into flat log files
- Offline functions: consist in database regular batch loading and aggregation of basic observations logs into prepared metrics and in offline querying and report presentation of those performance metrics.
- Regularly run scripts and associated database stored procedures upload the latest collector output files in input tables of the relational database.
- Regularly run scripts, invoking the BIRT reporting java runtime on pre-defined report templates, perform SQL data retrieval queries on the database and produce pre-built report files, e.g. PDF documents or HTML formatted reports.
- On-demand interactive access to the BIRT java runtime on Apache Tomcat server let a human user (e.g. network operator) instantiate, through his Web browser, a selected BIRT report template based on custom provided parameters.
