Deployment Architecture
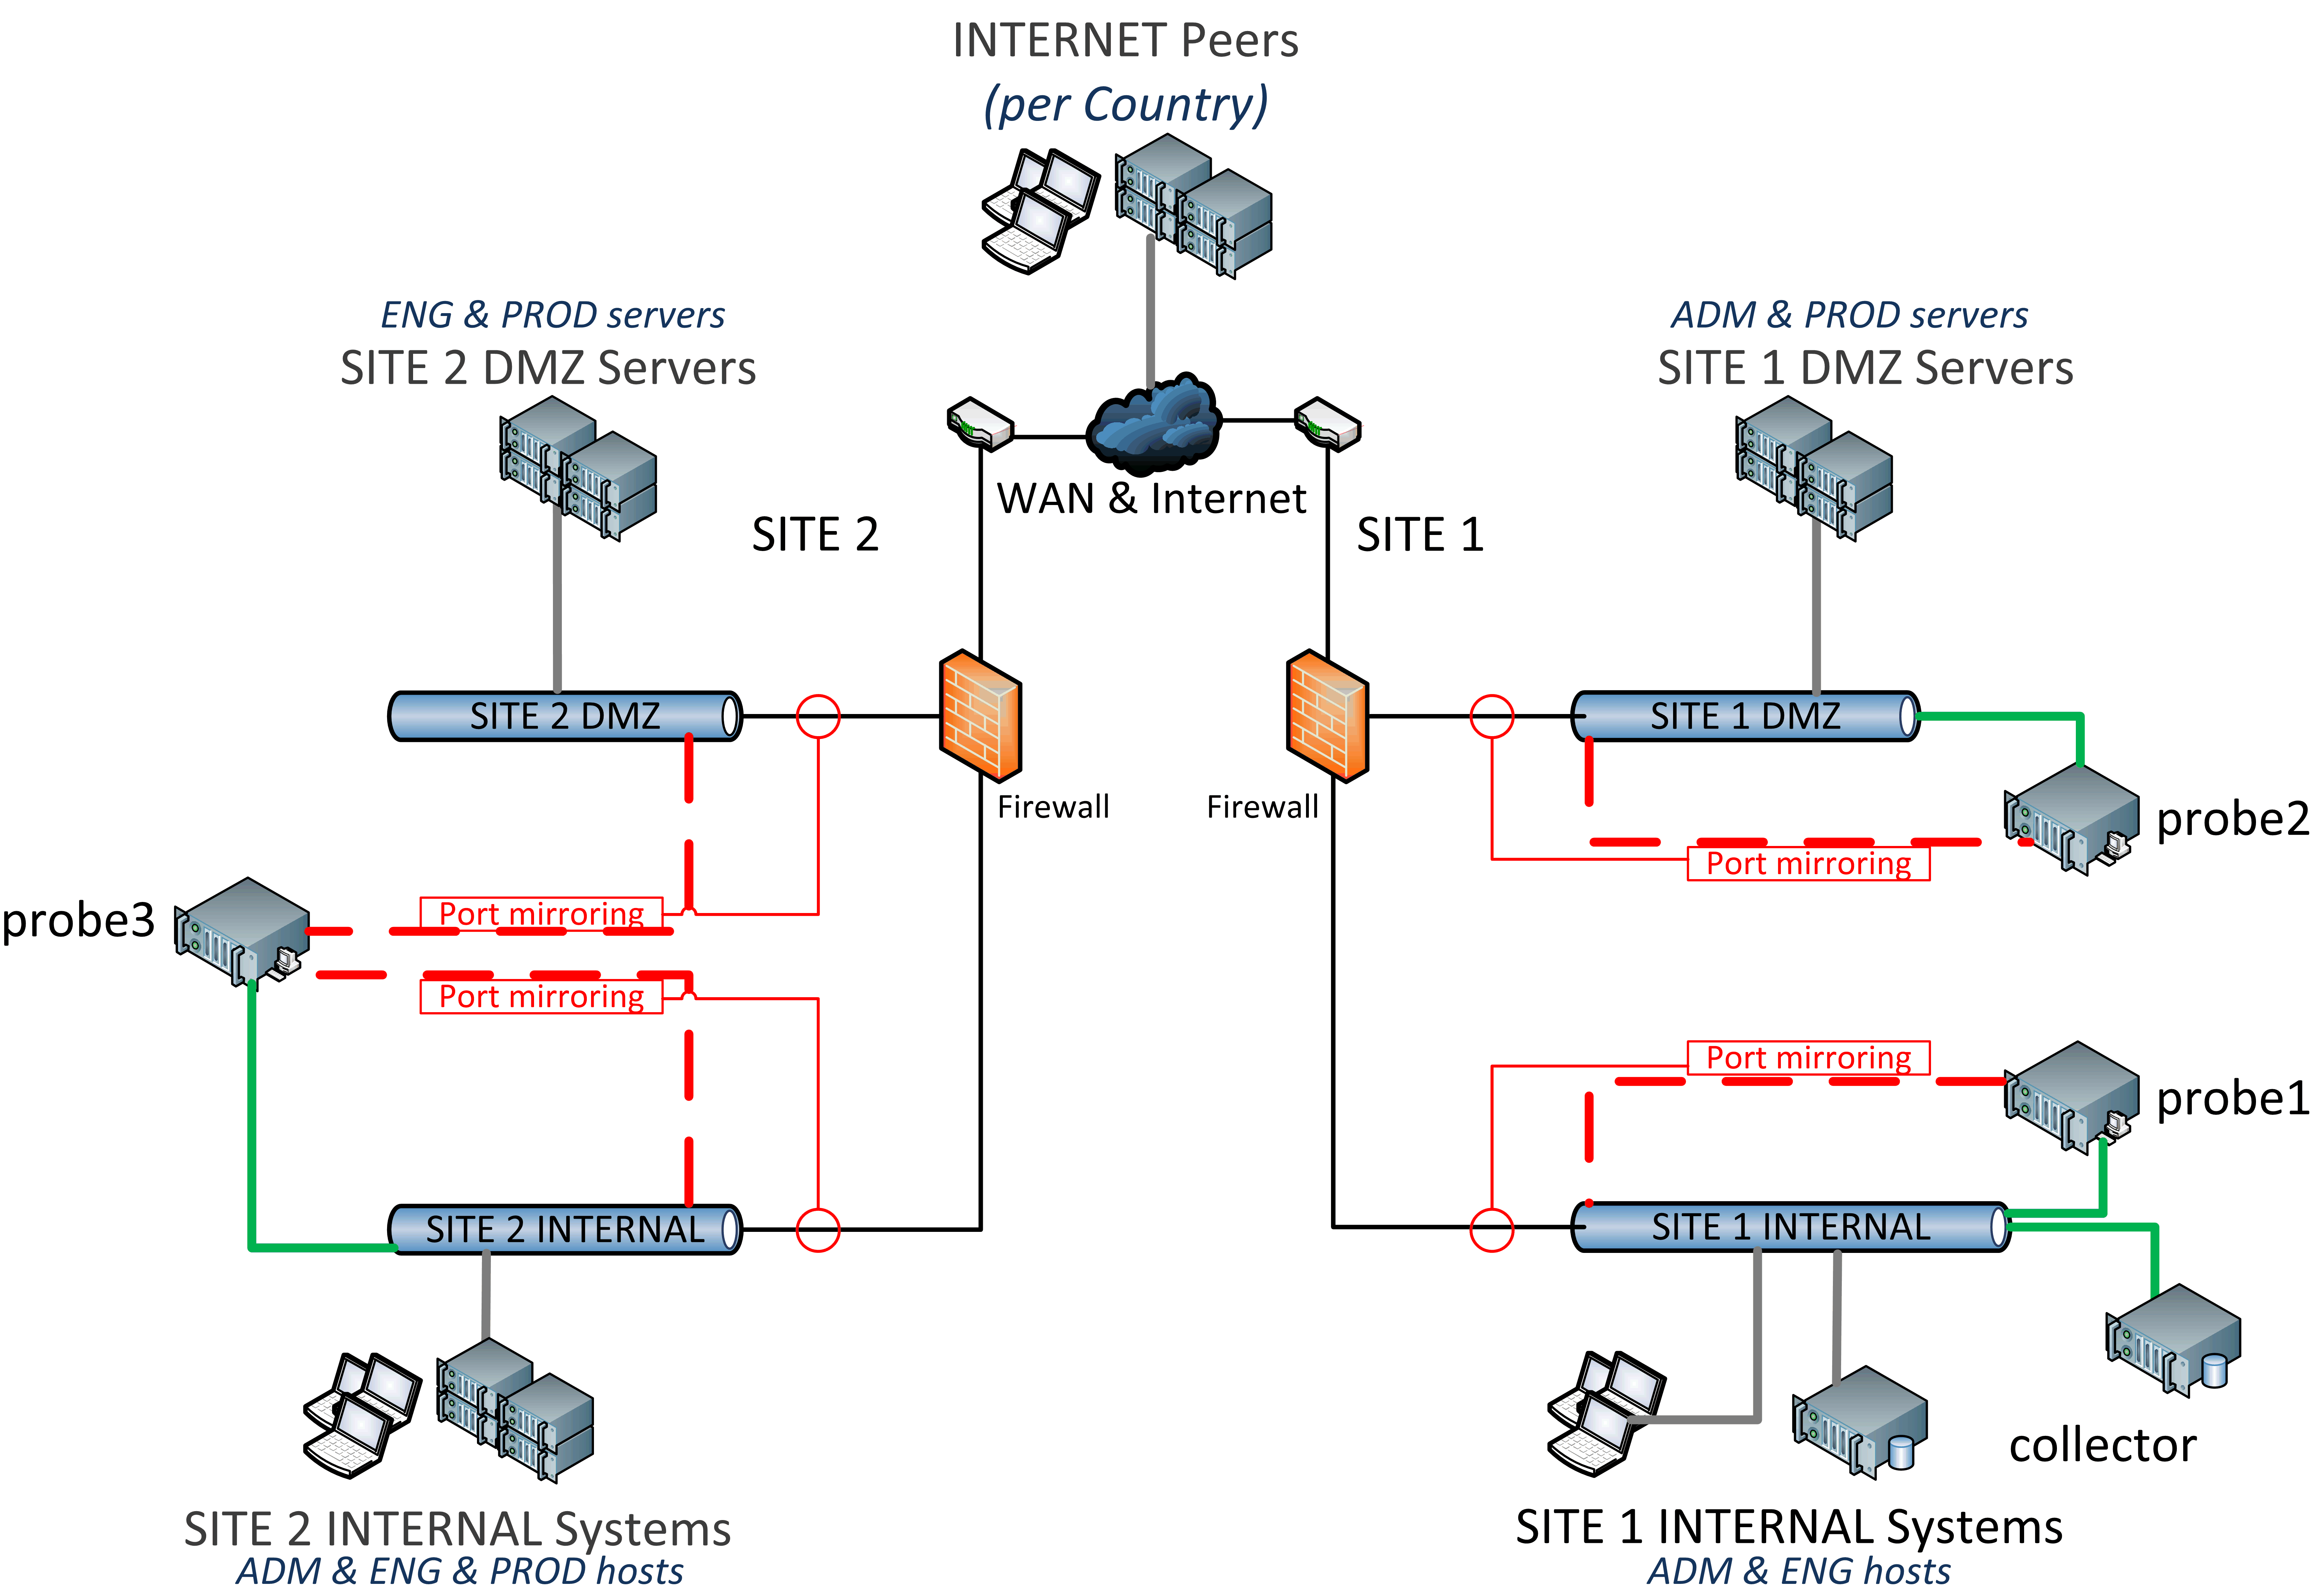
The figure below depicts a typical deployment architecture of the trafMon components.
The underlying model is that of an Organisation being spread over two or more production sites (could be buildings or even rooms), where the Local Area Network segments are structured as internal LAN and Demilitarised Zone (DMZ), with servers typically providing services to external users, over the internet, and to staff at other sites. With two sites, this could leads to four know ‘Locations‘:
- Site 1 Internal,
- Site 1 DMZ,
- Site 2 internal,
- Site 2 DMZ
Also part of the model, while not visible in the topology diagram, is the partitions of the computer systems according to the different ‘Activities’ which structure the Organisation, e.g.: Administration (ADM), Engineering (ENG) and Production (PROD). For instance, this leads to the following partitioning of IP addresses:
- @ Site 1 Internal: ADM hosts and ENG hosts,
- @ Site 1 DMZ: ADM servers and PROD servers,
- @ Site 2 Internal: ADM hosts, ENG hosts , and PROD hosts ,
- @ Site 2 DMZ: ENG servers and PROD servers.
In order to cover the monitoring of all data flows, we need to capture the incoming/outgoing traffic over the connection of all four LAN segments with their local firewall. This is represented by the probe “lasso”, which is materialised by the plug of a probe computer monitoring port (typically without IP address) to a span port (or mirror port) of the LAN switch, where the required packets are replicated. It could also be achieved through the use of Ethernet tap devices, but note that supporting pure passive tap devices (where IN and OUT traffic are replicated to two separate physical mirror ports) would require a slight change in the probe software, to preserve the respective order of occurrences of packets in both directions while analysing the protocol exchanges.
A same traffic Probe can capture traffic via two or more monitoring interfaces, as for probe3 below. But due to the processing load and computer hardware dimensioning constraints, it can be sometimes more appropriate to use one probe device per probing interface, as with probe1 and probe 2 in our example.
For observations derived from protocol analysis, the probe unique interface name is part of the name of each detected data flow instance. This avoid problems when a same flow is seen at different probing points, which is then appropriately handled upon aggregation of observation in the central database.
Some flows can also be monitored for their one-way latency and packet loss metrics. For instance regular SNMP requests from a Site 1 internal computer towards the switch of Site 2 DMZ. In this case, probe1 reports the source timestamp of the flow packets, together with their per packet identifying MD5 signature hash; and probe2 reports the destination timestamps and packet signatures. Both probes refer to the same one-way flow identified by ‘srcIP:high>dstIP:161‘, without probe interface identifier in the name.

At a convenient place in the network, typically on one side of the WAN data-link or at the centre of a star shaped topology, a Central Processing system gathers the probe observations. It runs the online trafMon Collector program which:
- receives the probe observations protocol data units (PDU), proceeds to their acknowledgement and duplicate removal, and feeds an input queue,
- handles PDU decoding and the output of complete observations to log files,
- reconciles the multi-probe partial observations and outputs one-way flow observations and packet loss information.
- gathers event notifications from the probe and detects its own remarkable events, logged and kept with the traffic observations.
Often co-located with the Central Processing system is the Database (MySQL) where all the raw and pre-aggregated data are regularly stored and updated. Stored procedures are also scheduled on a daily basis for the further aggregation implied by synthesis views, in terms of Activity/Location/Host and peer Internet Countries
The database Reporting system Eclipse BIRT is an open source software, which provides a platform to create data visualizations and reports. It can produced PDF reports in batch mode
It can also be embedded as a Java EE web application to generate and display on-demand web reports. For this, it is added a custom dynamic menu bar JavaScript application, built with AngularJS, JQuery and PHP, for the selection of report parameters values.
Finally, the trafMon distribution also contains testing tools: several types of traffic generators and a sample configuration where the trafMon probe can replay a pre-recorded packet capture file, either with same inter-packet delays, or at full speed to simulate heavy load.
