Components
The trafMon Collector: online centralising component
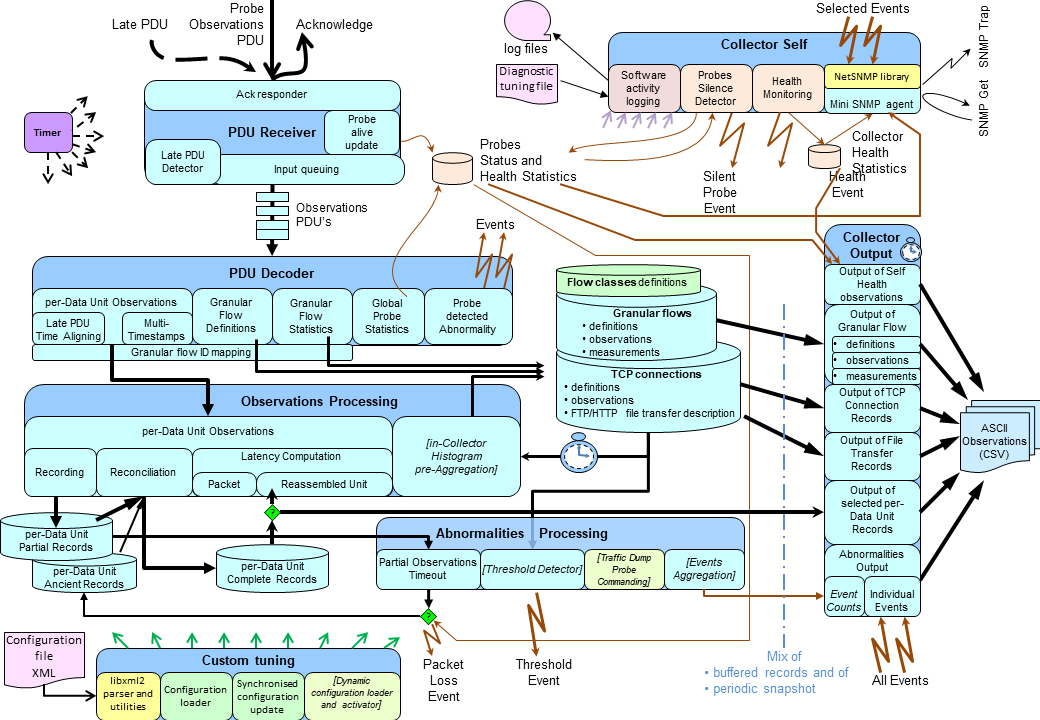
As for the trafMon probe, the collector is a C program that can be conditionally compiled with an embedded Net-SNMP custom sub-agent.
The central collector is continuously fed in near real time via reception/acknowledgement of different types of probe PDU, transporting raw observations on monitored traffic. Note that it is possible to implement a resilient system, where more than one collector are running at different “central” locations. In this case, the probes send their observations PDU packets separately to every collector instances.
The online reception of observations PDU serves a dual purpose:
- continuously feeding the database with fresh data
- checking that the connectivity with each probe is alive
For this second role, in absence of traffic, the probes regularly send empty heartbeat PDU’s. In classical deployment scenarios, where the TrafMon PDUs are mixed with the observed traffic, this permits to generate useful unavailability event notifications.

Most of the probe observations are complete information or pre-aggregated measurements. This can be directly written to the output log file of corresponding type.
Currently, no online threshold detection is applied, so the these probe observations aren’t further processed y the collector.
Note however that the description of discovered flow instances, and the slices of measurements data are produced only once by a probe run, then referred to by simple identifiers. This information is kept in the memory space of the collector. Hence it must always start before the probes, although some mechanism attempts to circumvent this issue.
There is however a special case where the collector plays a more important role: the precise measurement of one traffic by a combination of more than one probe. This case has undergone a careful implementation due to a specific context of use in the past.
The objective was to measure a series of low rate data flows of different priorities, some of which being real-time and suffering no latency lag in their long distance travel: time type of safety-of-life stringent requirements that you could impose to remote surgery communications. The probe PDU data were themselves considered low priority, hence the fully controlled, in size and rate, and reliable delivery protocol. Furthermore, partial observations of every packet had be encoded in the most compact way as to take occupy less than 1 % of the observed traffic.
When the collector receives a partial record about a packet MD5 hash, it stores the timestamps for this particular network hop. When the hop list is filled with timestamps reported by all probe on the packet travel path, the record is completed:
- it can be output as a series of timestamps for further custom processing, or
- the collector can compute the latency between two hops specified in the custom XML configuration
After a certained timeout derived from the maximum travel time over the network, partial records are processed and cleaned:
- Either the last timestamp(s) is (are) missing: the packet is lost,
- Or some probe or network device saturation/unstability or other condition has cause the lack of one or more timestamp while the last one(s): the packet is said missed,
- Or the probe with missing timestamp is silence since a sufficiently long time to declare the packet observations as dropped.
As for the probes, when compiled with its embedded Net-SNMP sub-agent, the collector can also forward its own events as SNMP notifications. Furthermore, this sub-agent implements a custom read-only MIB permitting a network manager to monitor the behaviour of the distributed trafMon online components.
