
Security Auditing & Building a Custom Report
In this example case of use, we illustrate through real-life examples the power of the trafMon tools in digging the traffic observations, trying to pinpoint security suspicious activity patterns. Not only do we give relevant example data queries with meaningful results, but we also highlight how the boundary between a normal peer communication and that of a security threat is thin. Although we terminate the presentation by a practical drawing of a synthesis BIRT report template, a real security audit may not concentrate only on the most visible traffic abnormalities (most active scanners, widest scanning of own systems, day with highest increase of ingress traffic …): the highest threat comes from those network exploits that make the less noise. Hence unacceptable peer activity does not necessarily show up in the Top-5 or even Top-20 figures. A complete security audit must involve second and third level of custom queries, applied to the entire set of first-detected long list of candidates.
This example is reproduced in an associated tutorial document. MySQL stored procedures have been written for the two first-level queries for low-profile traffic and for external ingress volumes, as well as for the associated summarising queries. Those last are the source ‘data sets’ for the example BIRT report. So, the tutorial is accompanied by an SQL file and a BIRT report template and published as a supplementary package downloadable from the Download page of this web site.
1. Host Scanning by Internet Systems
1.1 Long Duration Hidden Scans with Very Low Traffic Profile
When looking at the synthesis reports (Manager and Operator or Conversation reports) at the level of a single system, we observe that a great part of remote Internet peers is exchanging very low profile of traffic spread over a long time period.
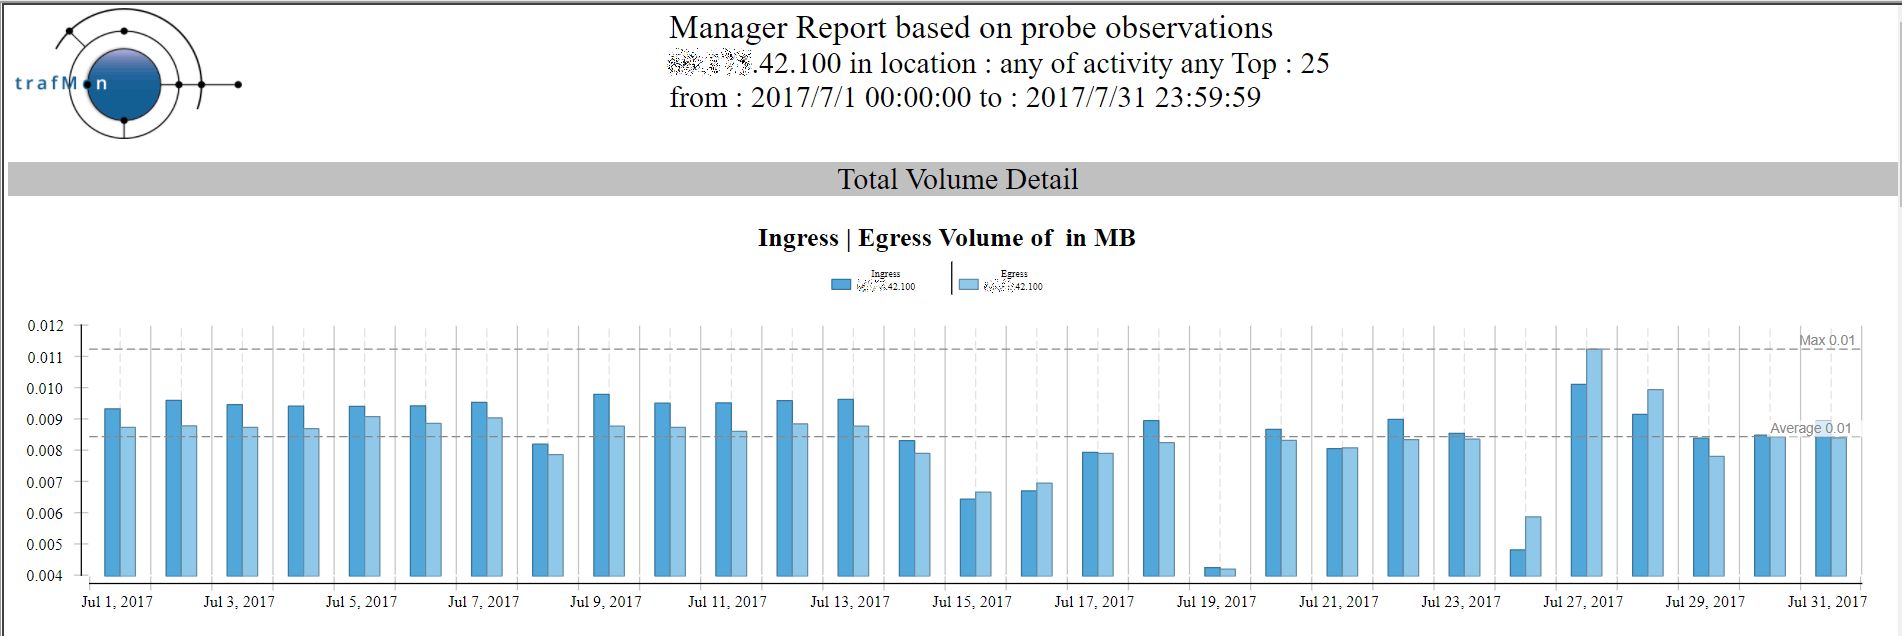
Let’s have a look at internet host x.x.42.100. Below is the amount of daily traffic with this remote external peer over one month, to and from the top 25 reached local hosts:
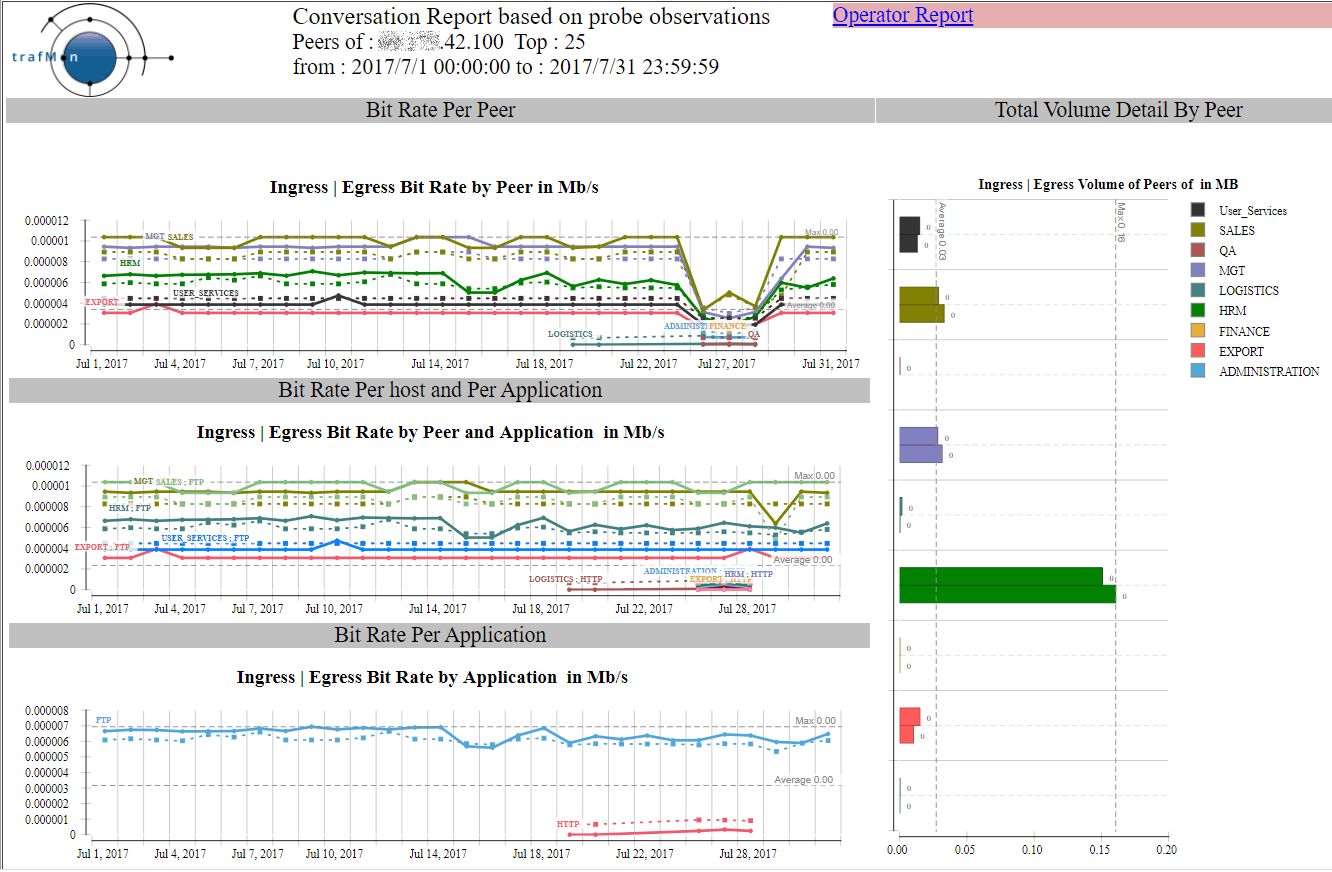
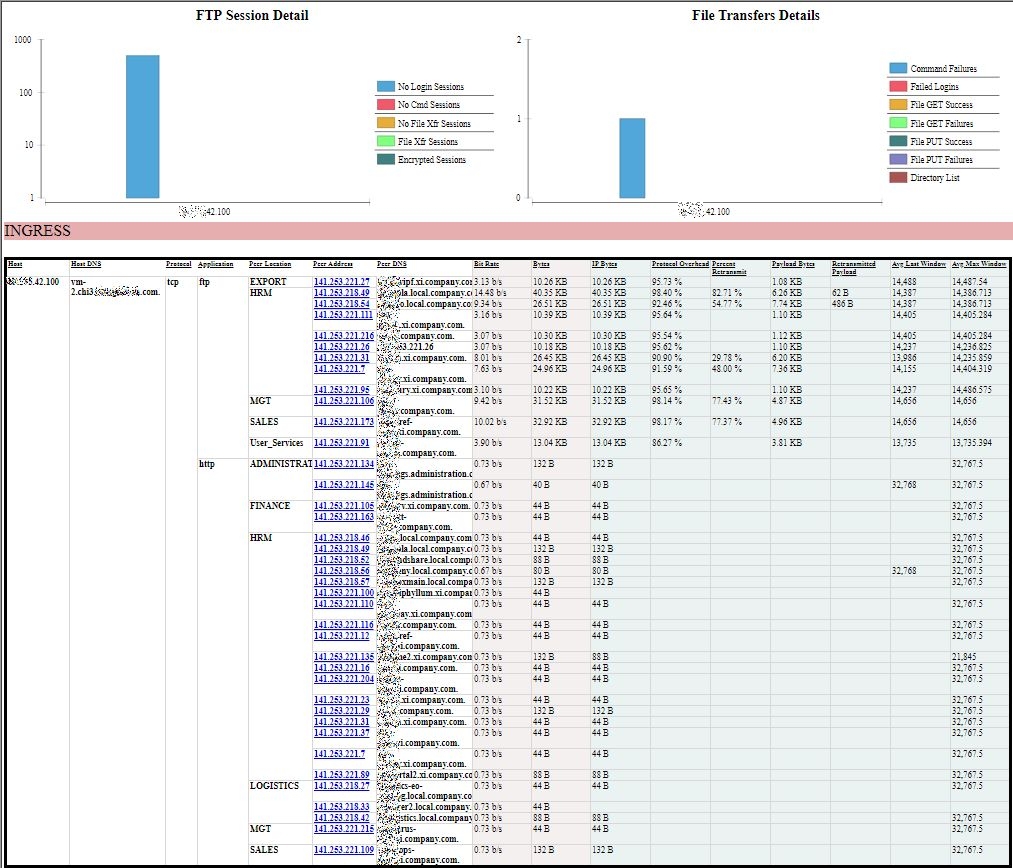
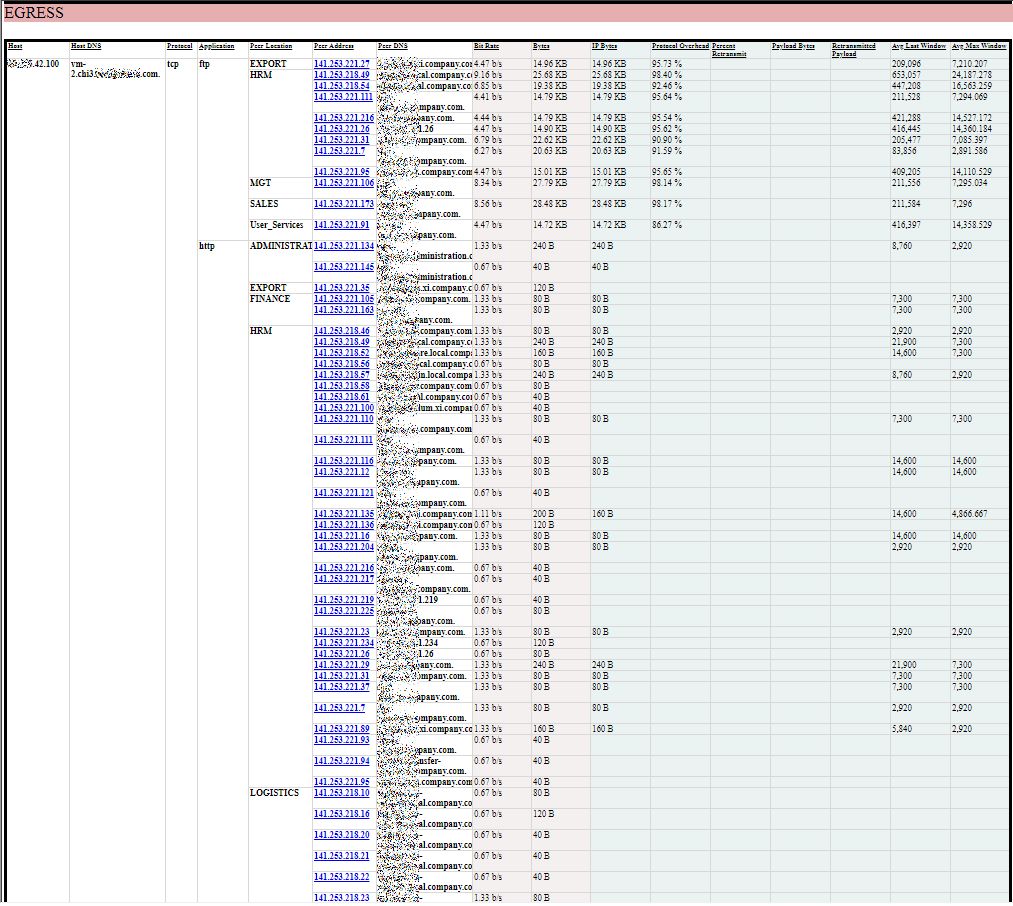
And the corresponding Conversation report shows that, despite its low volume, this external remote address reaches quite a lot of different “own systems”, using different service ports.
Fortunately, when using FTP, it doesn’t succeed of even try to login.
INGRESS
EGRESS
1.2 Exhaustive List of Scanners (and Others)
A more systematic search for remote external scanners starts with the creation of a table with all pairs of one external system (non-private IP address, without Activity nor Location qualifier) and one own system (with designated Activity and/or Location), summing-up the number of packets and of bytes exchanged each individual day.
This table is ordered, first, by ascending external IP address (using INET_ATON(remote)) then, second, by ascending “own” address (using INET_ATON(local)), then only by service port and day.
The sql query looks like:

In the above SQL statement, low traffic is already at a high limit (30 packets and 3000 bytes a day). The reason for this is to produce (or regularly recreate at night) a persistent table encompassing, among other, all interesting patterns for further inspection. This has been implemented as a stored procedure, in the downloadable add-on trafMon_SecurityExample package:
`trafMon_SecurityProcs`.`Refresh_lowTraffic`(IN `_DBname` VARCHAR(20))
At the time of manual analysis, it is then quicker to extract from this prepared lowTraffic table those line matching a more reduced volume of exchanges (e.g. 10 or 20 packets a day for a total of 1000 or 2000 bytes).
From this result, ANY suspicious scanning patterns deserves further manual examination. It is a rather tedious process, but it allows to avoid black-listing true clients that otherwise conduct more normal (and necessary) protocol communications, but being exhaustive in identifying the undesired spies.
Here are some relevant practical examples extracted and anonymised, from real trafMon observations.
1.3 Single-day Scans Examples
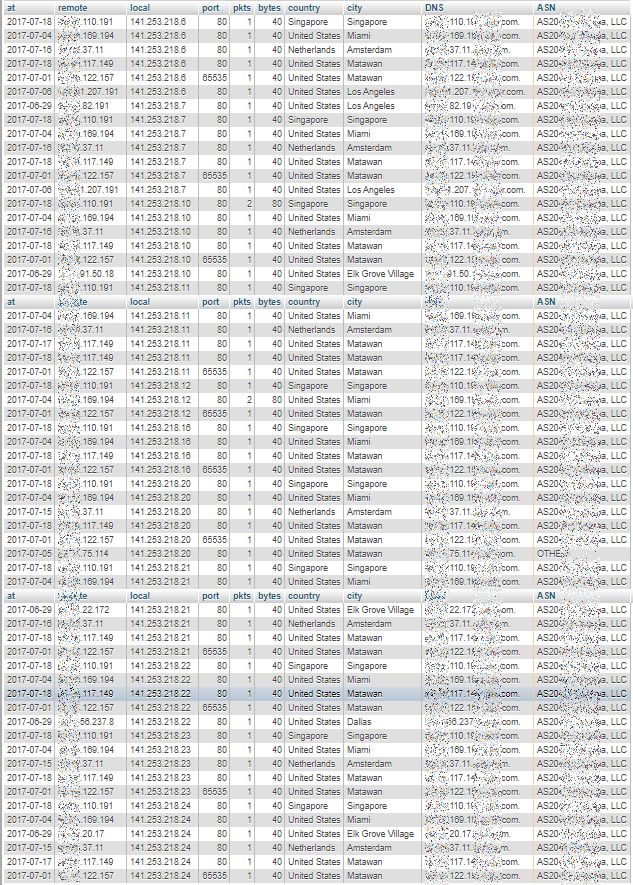
By browsing through (excerpts of) the lowTraffic table, we easily identify when, in a same day, a same remote IP address appears in consecutive lines whose local address field consecutive values form a nearly complete sequence of our own addresses ranges.
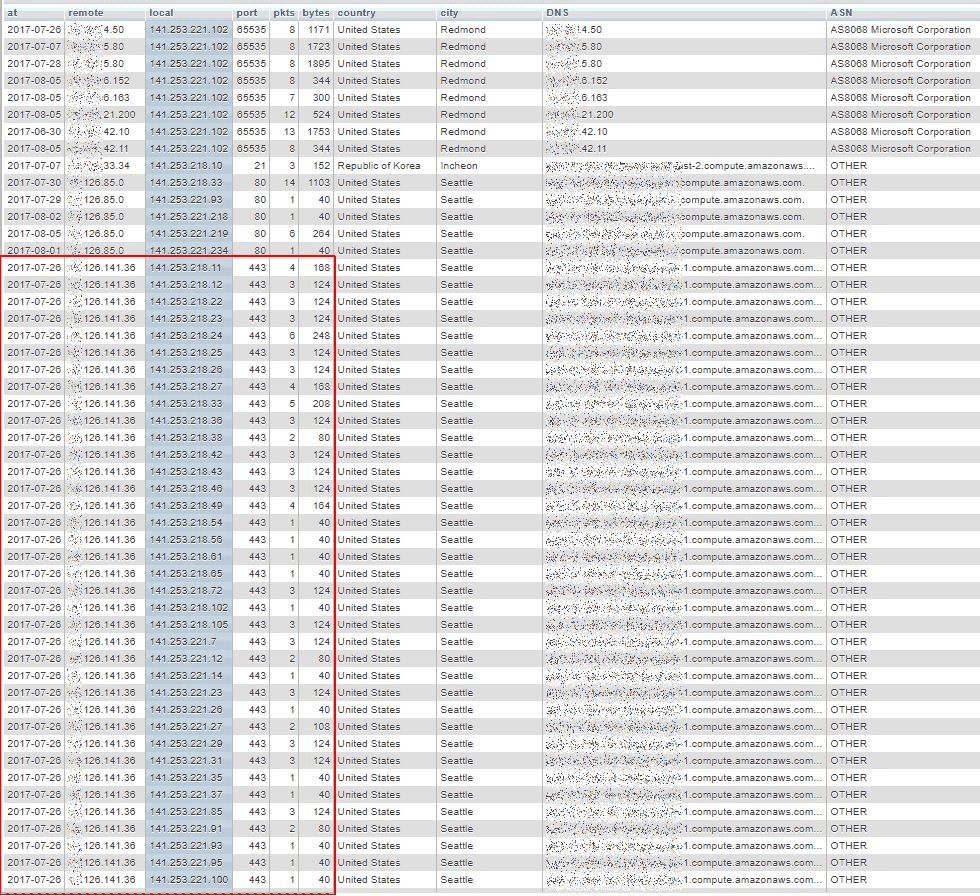
And the above list continues after the bottom of the picture.
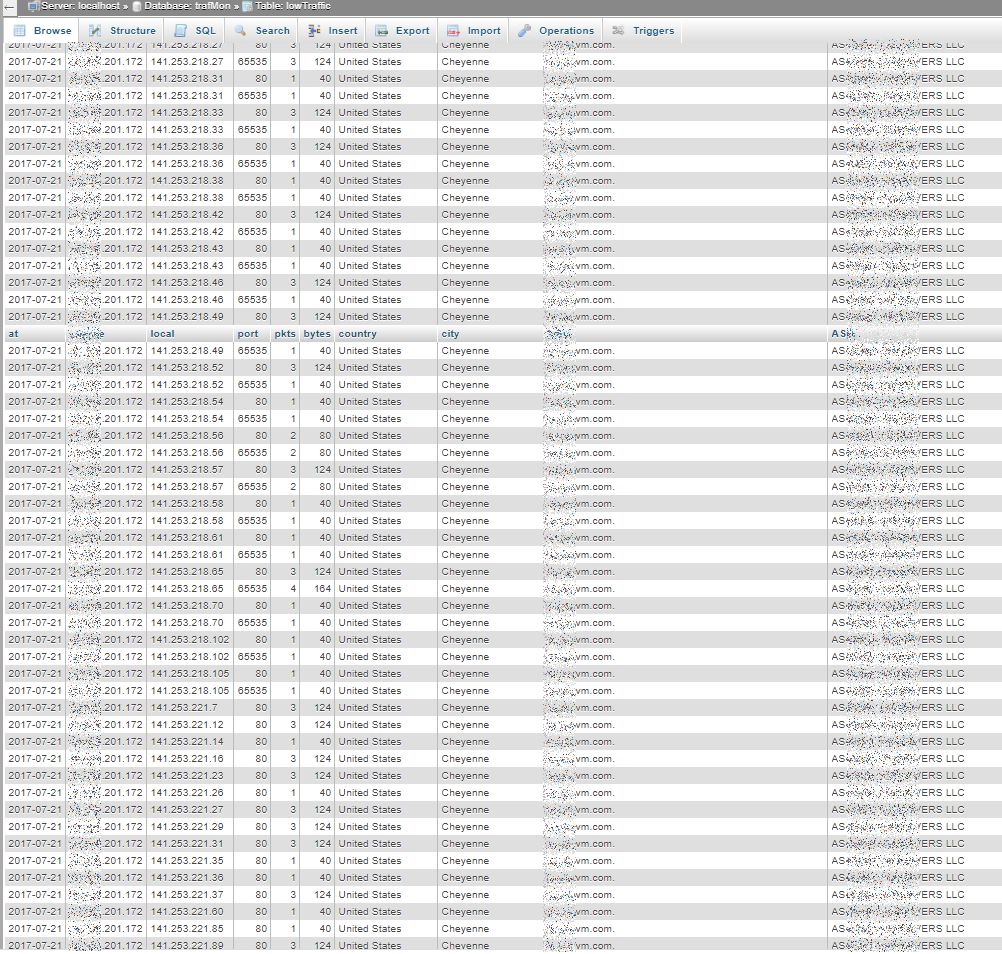
In the following example, the scanner tests the HTTP (80) service, but also another unprivileged port number (65535 stands for ‘high port’ above 1024). Here also, the figure shows only a part of the scan sequence:
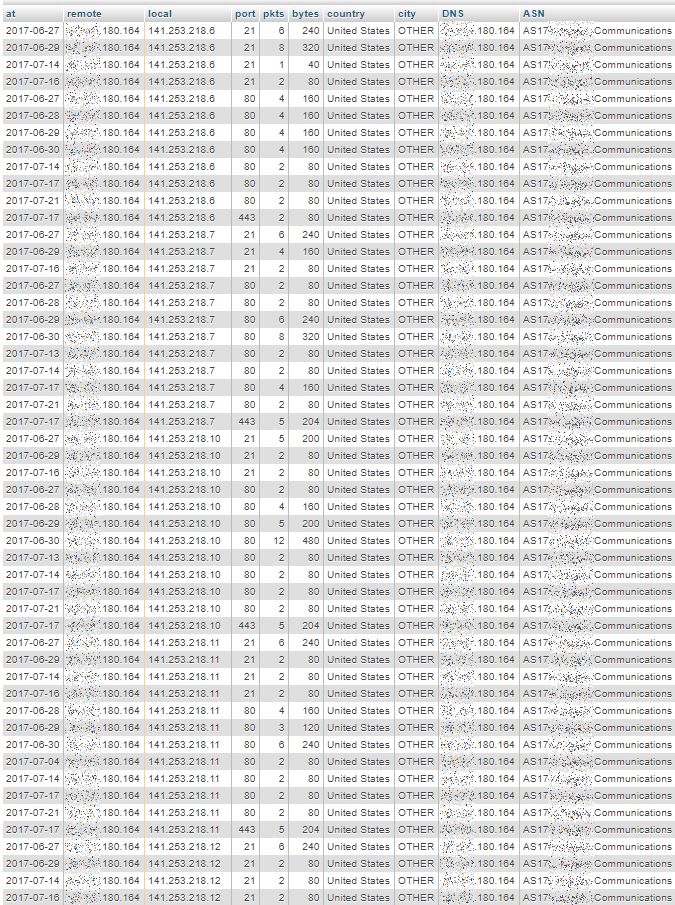
In the following example, the remote system seems to perform complete daily scans, repeated on 11 different days of about a one month period, using different target service ports – FTP (21), HTTP (80), HTTPS (443). The figure is truncated, there are 1078 rows like that in the pattern:
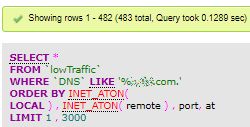
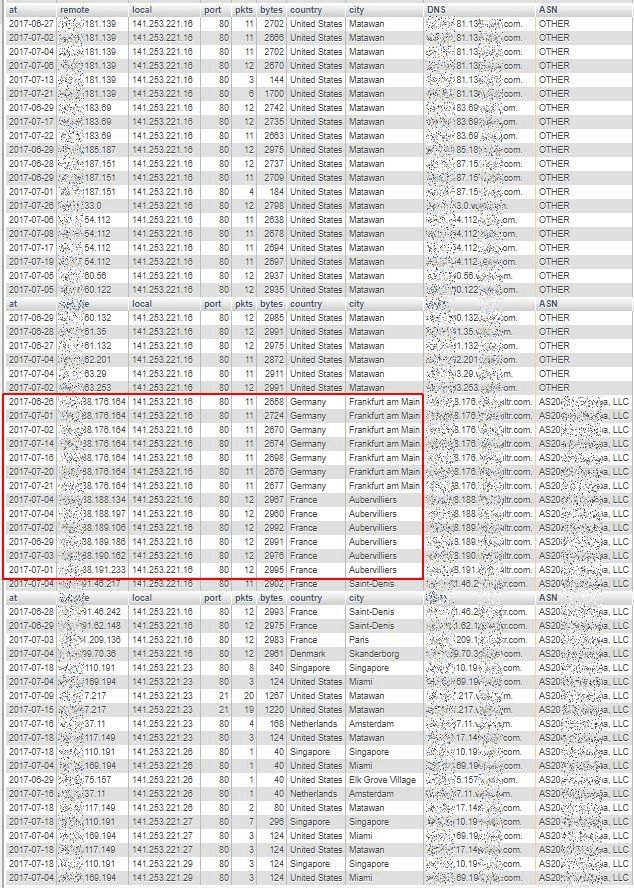
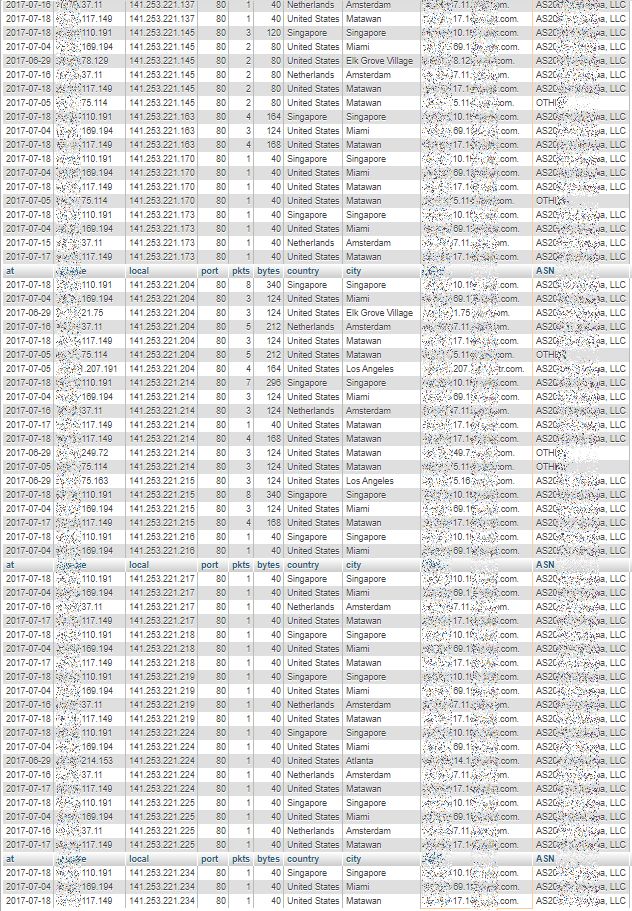
Searching on the basis of DNS domain name part highlights what seems to be different complete daily scans (same remote address for a given day), but repeated by different remote addresses on different days, all belonging to the same DNS domain name, although geo-located in totally different countries and cities:
First Page: lowest “own” addresses
5th Page: middle of “own” addresses
Last Page: highest “own” addresses
When looking, for instance, at the volumes shown by some remote systems from France and Germany (that are in the red rectangle of the central image above) there seems to be a more significant volume exchanged. So we need to further analyse the TCP connection counters related to the entire traffic for the available time span of observations (a bit more than July 2017).
We can then sum-up the daily traffic (packets and bytes) of each (uni-directional or bi-directional) flow with, for instance, the remote system from Frankfurt, in order to ensure that it isn’t a normally behaving peer.
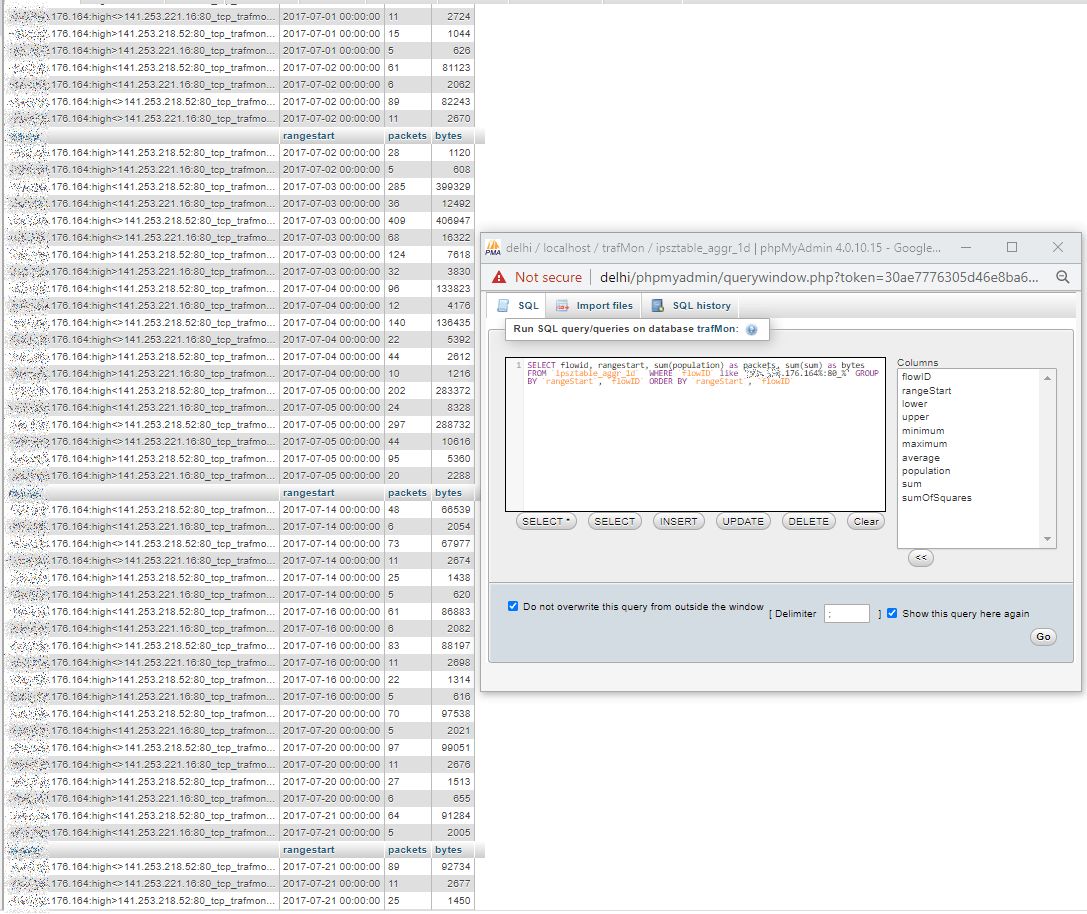
Indeed, this peer has several more significant HTTP exchanges, as also exhibited by the corresponding trafMon Manager report over July 2017:
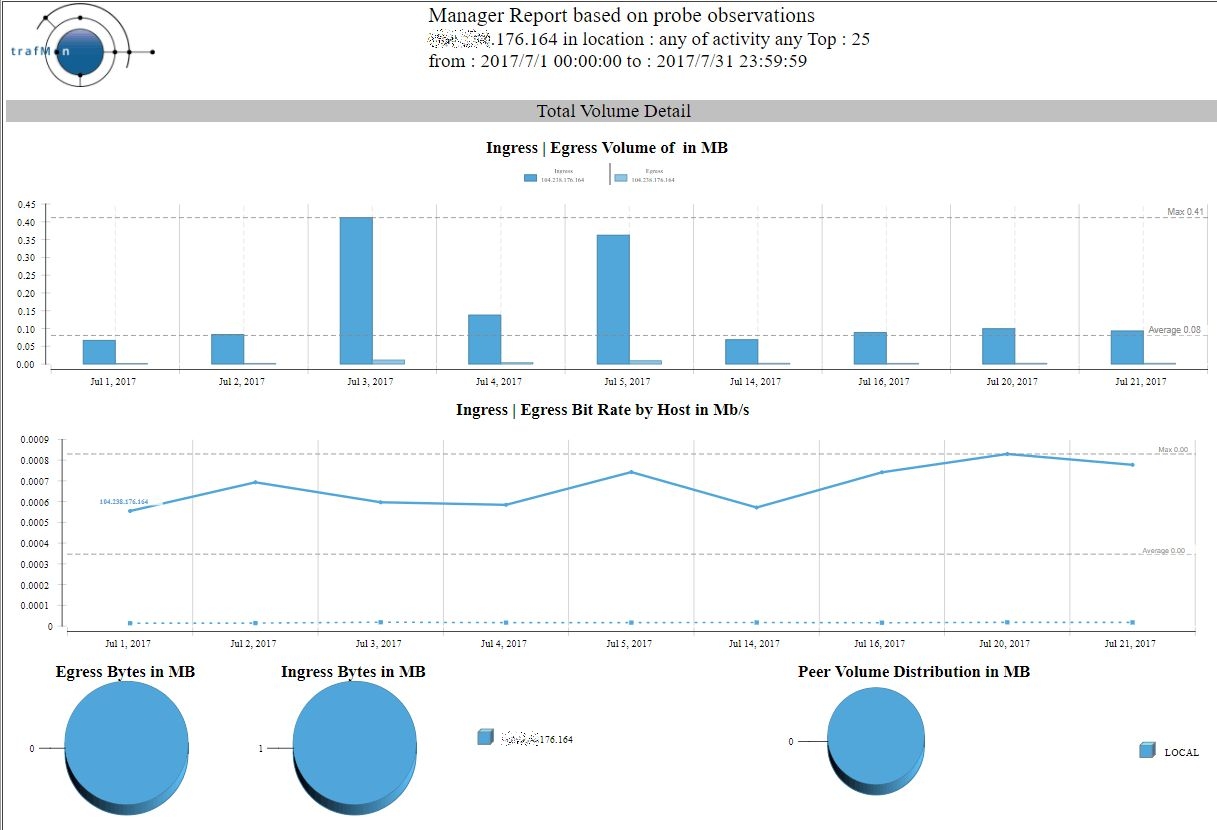
As a conclusion, many of the remote peers belonging to the identified DNS domain name look like scanners, but some such peers cannot be de facto considered as malevolent. Their communications behaviour would require more dedicated monitoring.
1.4 Revealing Hidden Multi-Day Scans
Up to now, we have identified systems that were scanning multiple addresses in a same day. Even the day can be a long time span, but when these scans occur within a small time window, they can be detected and rejected by intrusion detection systems (IDS).
However, there are even more vicious scanning behaviors, where it is very difficult to detect that our several own systems have actually been reached.
Let’s take a look at the following figure. We see that a remote system from Malaysia is actually reaching a sequence of or own systems. But this is because we have ordered our lowTraffic table by local addresses!
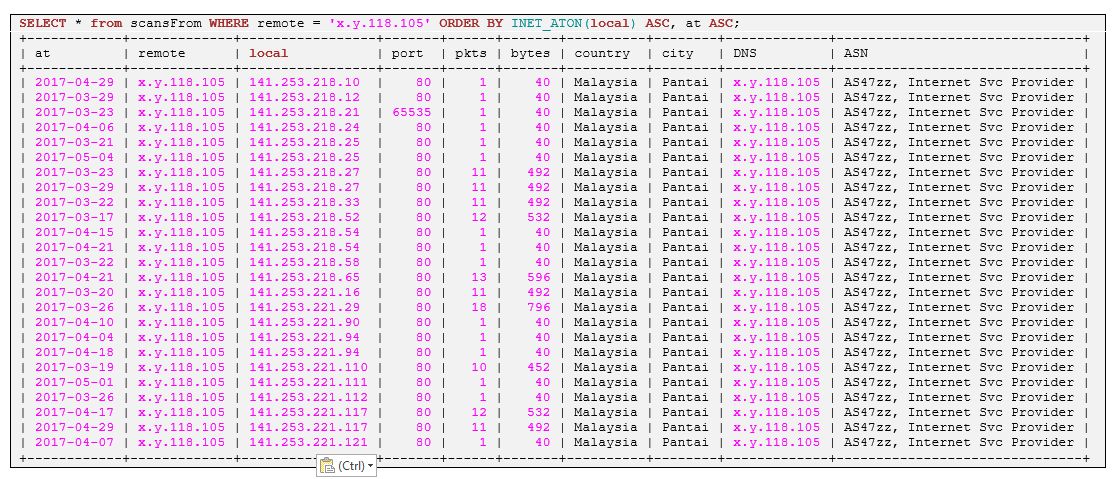
When we order the query by increasing dates, we can see that the scan was occurring over 19 different days out of a period of 188 days:
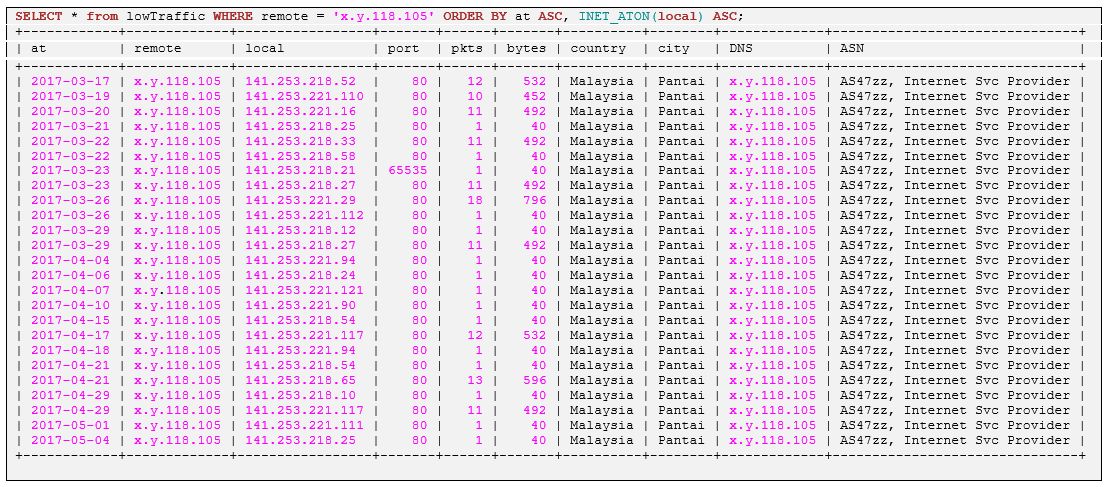
This system from Russia seems also scanning several own systems spread over several days: first ordered by local addresses:
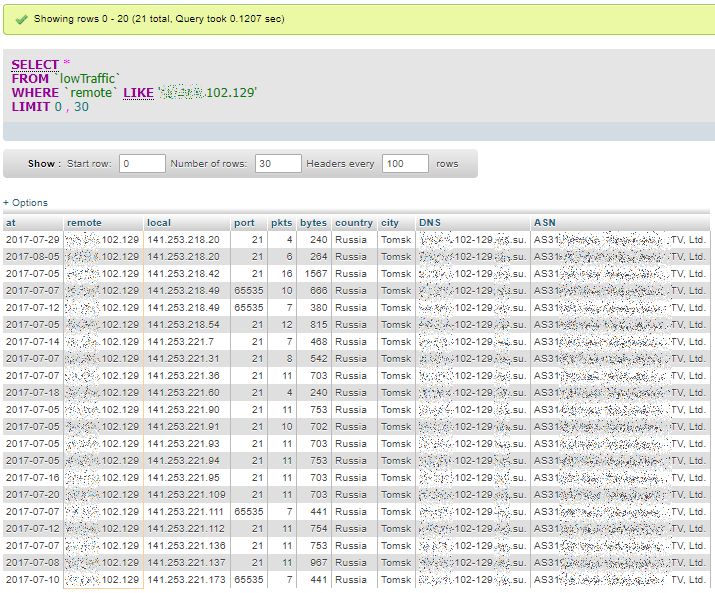
Then ordered by date of occurrence:
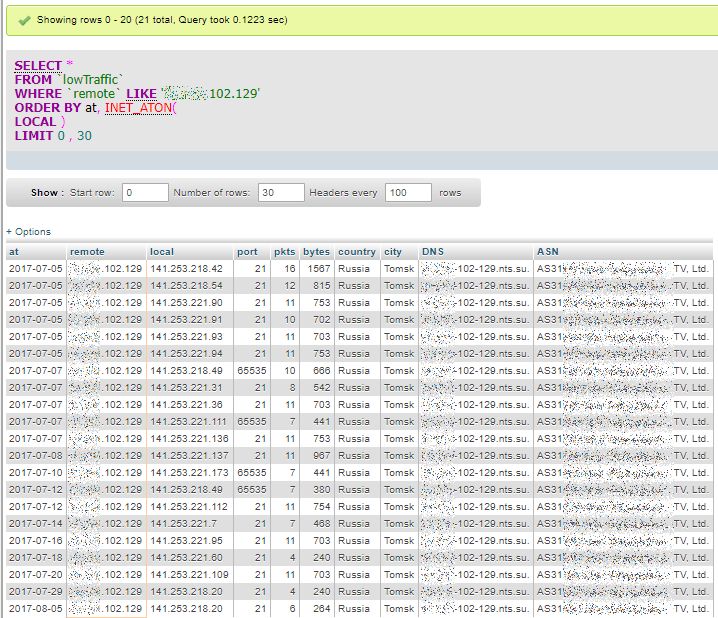
Now we can look at what this system actually performed in using FTP protocol. So we retrieve its bi-directional flows and look at values of its relevant FTP Counters: 3 times (on 3 different days 5th, 7th and 8th of July 2017) it failed to login. But on the 12th, it succeeded to get in and to conduct a directory listing in passive mode.
Either this system is a normal (but not expert) client, or it’s fourth try did succeed!?!

1.5 Discovering Batteries of Scanners
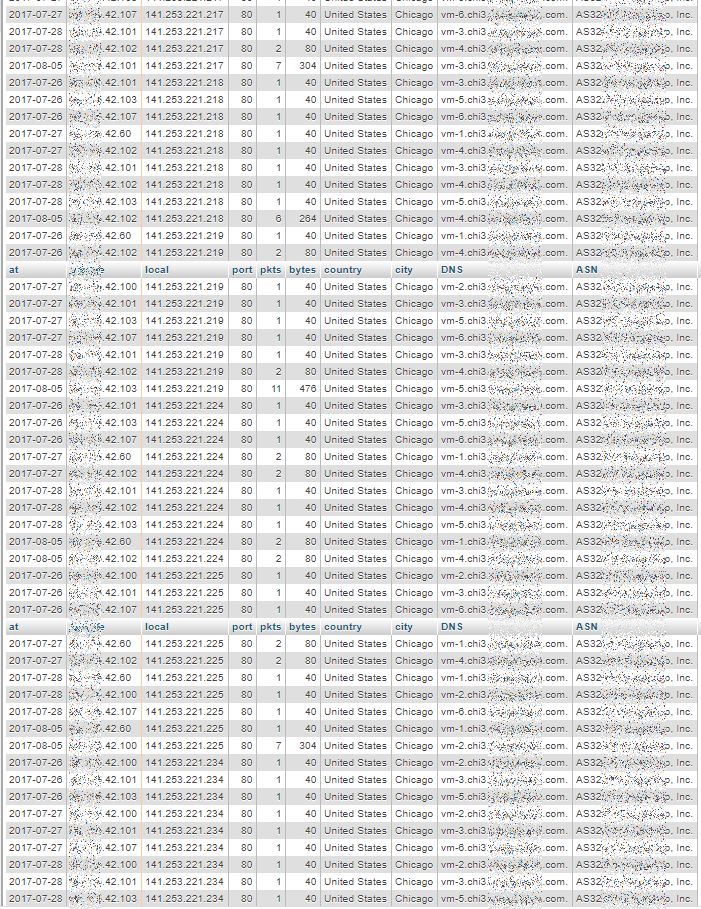
When browsing and carefully inspecting the lowTraffic table, and thanks to the fact that remote addresses are also ordered, we can see that patterns, supposedly identified as scans, are repeated for different remote addresses that belong to a same range. This is as if a battery of several different remote systems were sharing the scanning work. This is also something difficult to detect, unless when inspecting long term data sorted in meaningful order.
The three views below are displaying a part (top, middle and bottom) of a long result of 1037 rows, which seems to indicate multi-day scans conducted by a group of remote systems with addresses close to each other: x.y.42.60, x.y.42.100, x.y.42.101, x.y.42.102, x.y.42.103 and x.y.42.107.

First Page: lowest “own” addresses
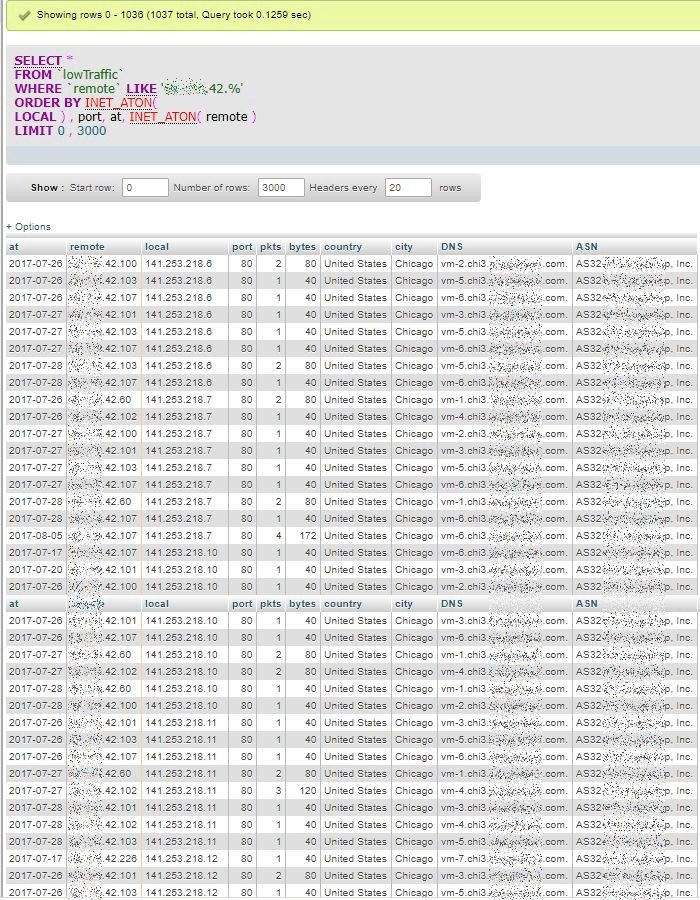
Middle Page
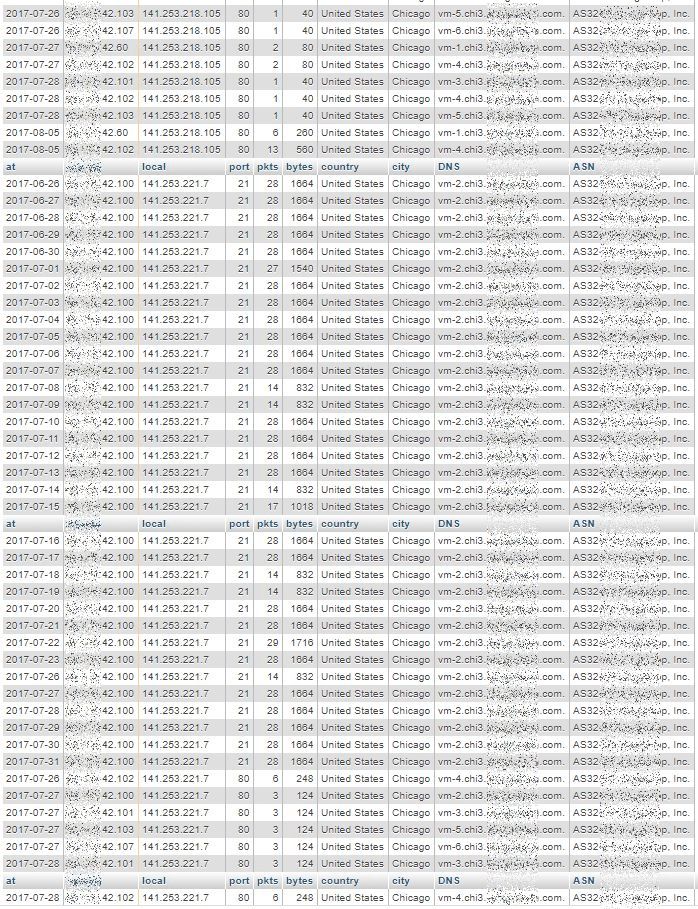
Last Page: highest “own” addresses
2. Abnormal Daily Ingress Volume Peak
After having looked at apparent scanning patterns, we can also focus on possible attempts to overload own systems. These would exhibit abnormal daily peak of ingress traffic volume.
2.1 Per Own System Daily Ingress in Decreasing Order
First, we create a table in_VolumesExtern, by summing up the packets and bytes counters coming from all external systems (not private IP addresses, without assigned Activity/Location) towards own systems (with assigned Activity and/or Location).
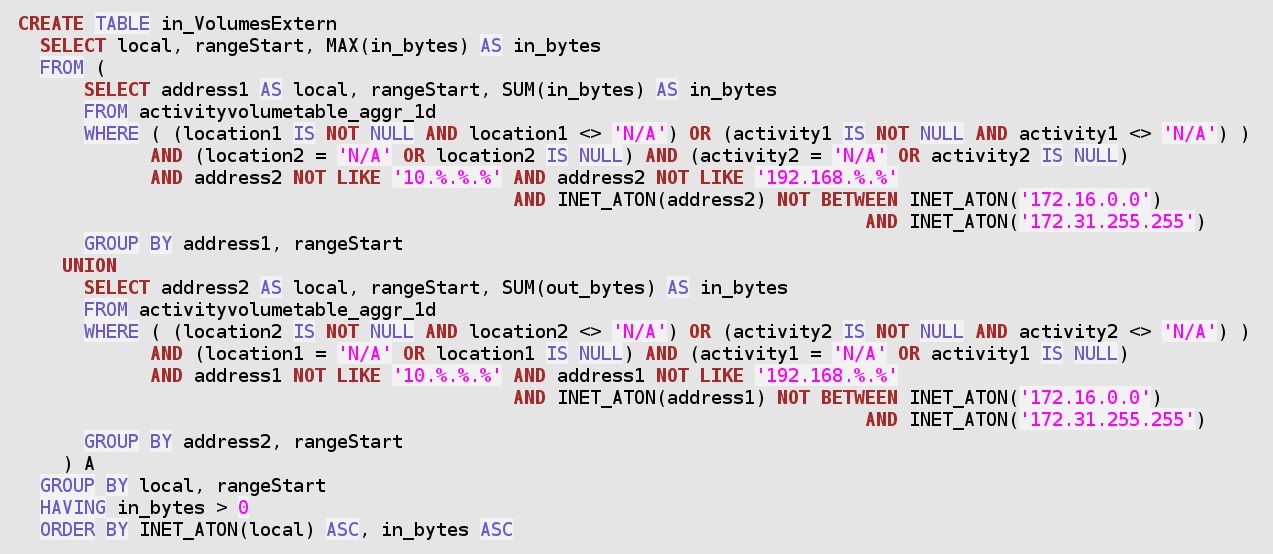
The above SQL statement covers the entire span of available data. The resulting in_VolumesExtern table should therefore be recreated regularly at night. This has been implemented as a stored procedure, in the downloadable add-on trafMon_SecurityExample package:
`trafMon_SecurityProcs`.`Refresh_ExternInPeaks`(IN `_DBname` VARCHAR(20))
At the time of manually conducting the security analysis, it suffices to dig into this already prepared table to retrieve peak daily volumes of interest.
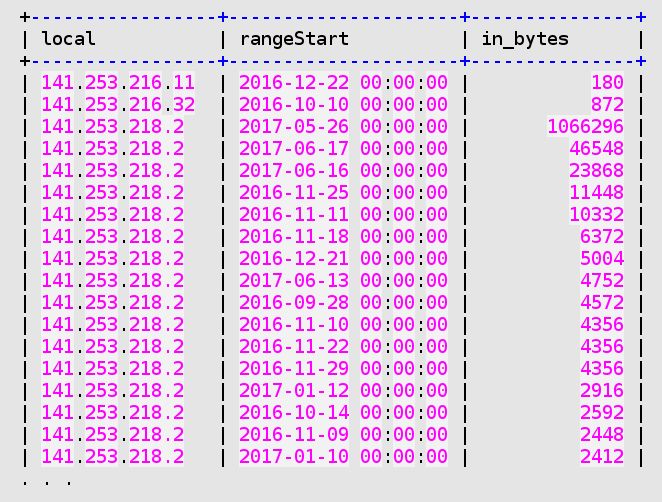
By browsing through the in_VolumesExtern table, we can easily compare the daily ingress traffic peaks, numerically sorted, and detect abnormal jumps.
The following example concerns a system (141.253.218.2) that has been applied a Nessus security scan on the 26 May 2017. We see that its top ingress traffic daily peak is 23 times higher than the value of its second ingress daily peak.
So we take a closer look at this server traffic on that top peak day:

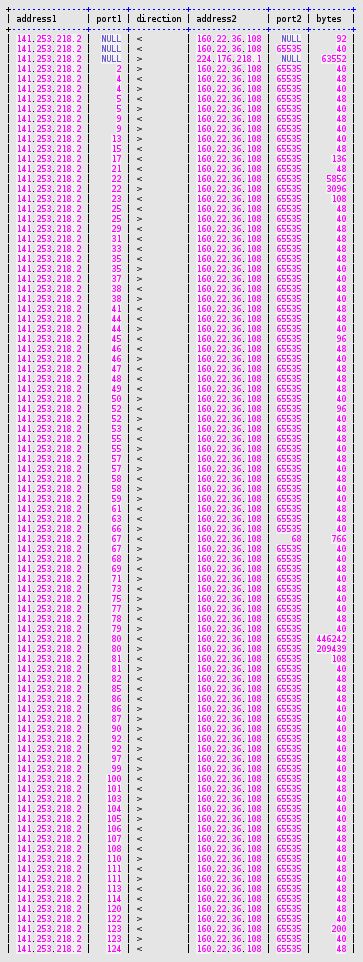
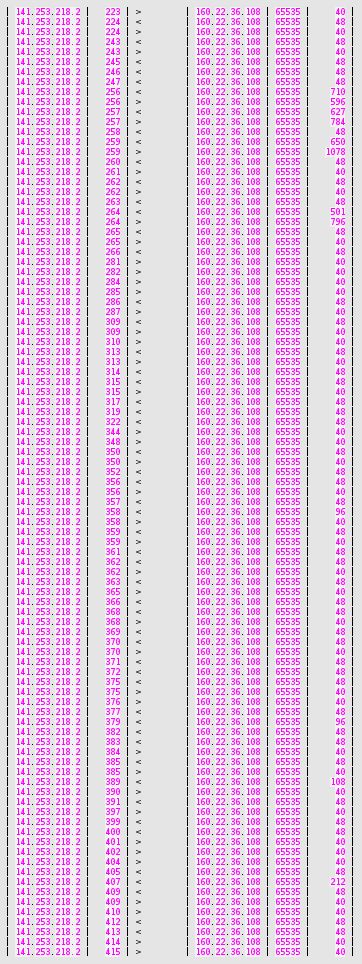
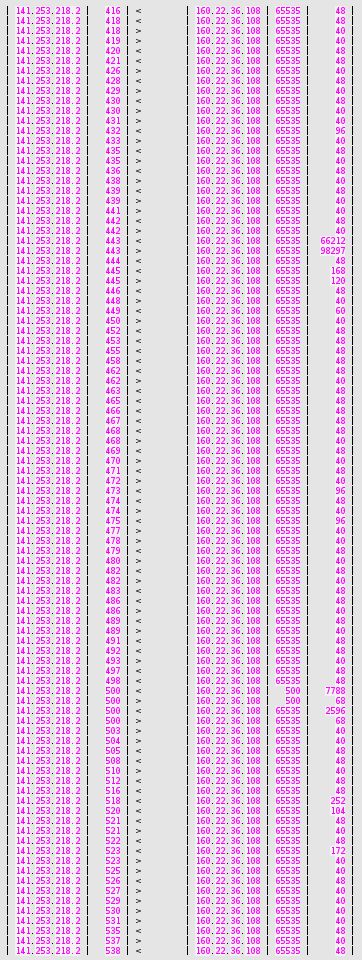
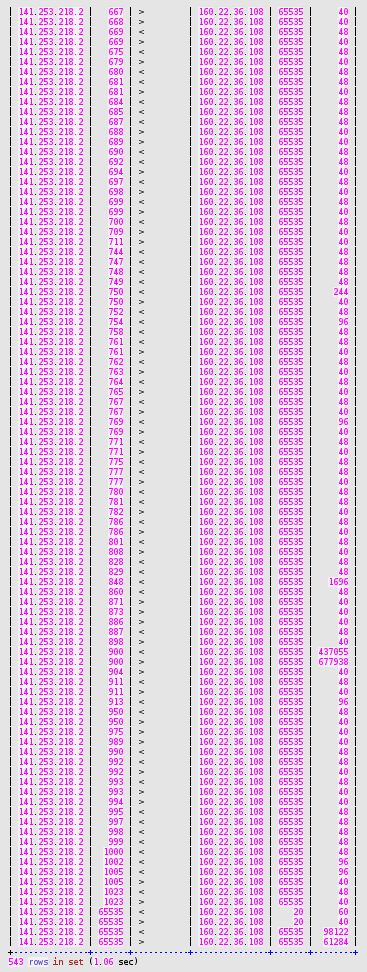
Inspecting the above results, we see some significant outgoing bytes towards a multicast address (224.176.218.1), and all the rest is related to the port scan and the penetration testing by the Nessus scanner (fake address 160.22.36.108):
- limited SSH exchanges (port 22),
- more significant HTTP volume (port 80),
- NTP (port 123) attempt,
- SNMP (port 161) attempt,
- CheckPoint-specific attempt (ports 256-259, 264, 900),
- exchanges in HTTPS (port 443),
- IKE (port 500) attempt,
- unknown attempt to port 848,
- voluminous exchanges on port 900 (CheckPoint-specific HTTP Client Authentication),
- and significant exchanges on unprivileged high ports (65535 stands for “above 1024”).
2.2 Second to Top Daily Peak Multiplier
So, the method of identifying, for our own systems, where the top ingress daily peak is a multiple of the second higher ingress daily peak, is a good way to point to potential traffic overload attempts.
By what factor is the volume first peak larger than the second peak?
Based on the table in_VolumesExtern presented above, the following queries sequence automatically retrieves:
- the top peak ,
- and the second highest peak
In order to compute the percentage of sudden increase, and to sort the resulting list of potential bombarding of our own systems, we use the following query:
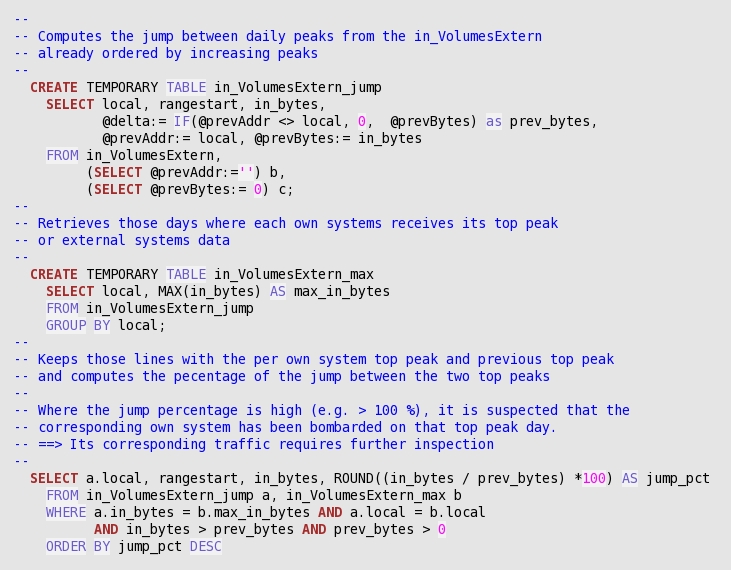
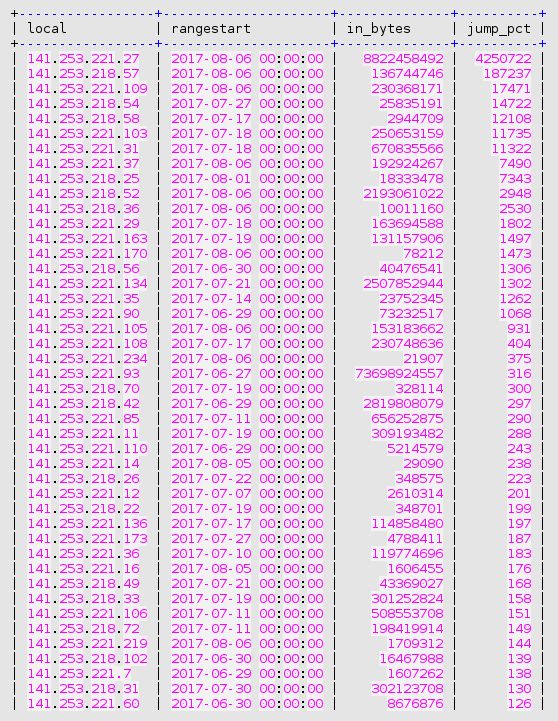
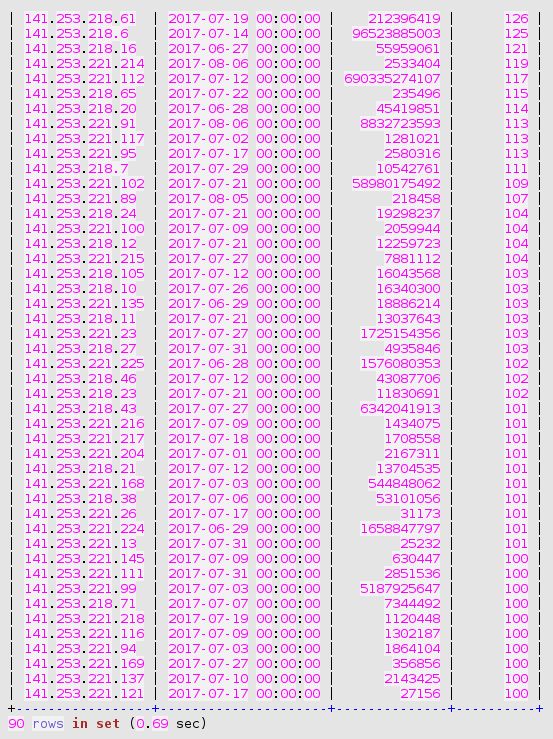
And, in order to further identify the cause of a jump in traffic volume towards a given own system, the following query is meaningful:

Once again, the result is ambiguous. The 8 GB big ingress peak to the HTTP server from the Ukraine system is accompanied by quite more normal traffic patterns exchanged with peers from the same DNS domain, and belonging to the same class B address.
- So either this Ukraine-based Organisation is a normal partner. And one of their system has once provided us a big amount of data.
- Or all these systems were jointly participating to an attack attempt.

Anyway, this type of second step query is so classical in conducting security audit of the trafMon collected observations, that is has also been implemented as the stored procedure
`trafMon_SecurityProcs`.`Top_IngressTo`(_DBname, _Date, _Local, _topN)
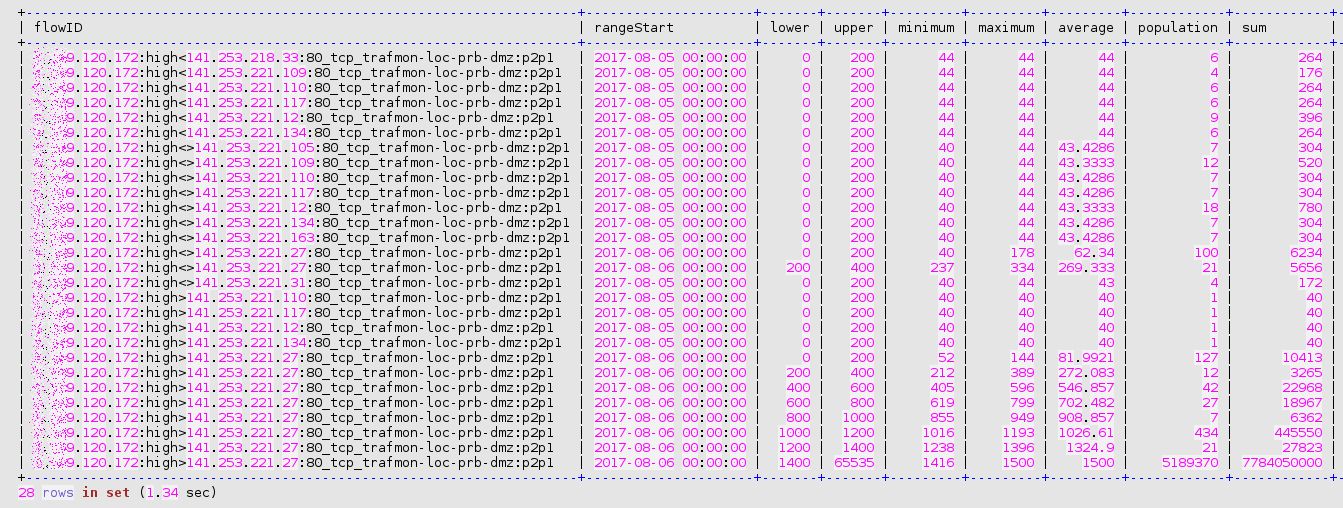
Although trafMon is counting a large amount of ingress packets and bytes from the remote system on Aug 6th, 2017, no single corresponding egress packet is counted for that day. It may be due to the saturation of the switch span port that fed the probe (which occurred regularly). However, related suspicious security patterns, in two directions this time, have been observed the day before.
Indeed, on Aug 5th, this remote system behaved like a scanner: mostly very few small packets exchanged with several own systems of the same address segment. Note also that the set of related remote peers, from the same class B, appear in 15 917 rows of our lowTraffic table, and only during these two consecutive days: 5 and 6 Aug, 2017!
3 Security Summary
Although the presented security investigations are by far not exhaustive, quite a lot of interesting results have been obtained by concentrating on low profile daily traffic and on explosion of daily peak ingress volume.
Hence it is time to formalise the first step of the investigation as a series of MySQL stored procedures. An example synthesis report can be drawn, which presents only the most visible tip of the iceberg; hence the security auditor should most extensively browse to every occurrences of suspicious patterns.
3.1 Stored Procedures
As said above, two stored procedures are preparing the base data in two persistent tables (lowTraffic and in_VolumeExtern). These should be regularly called for maintaining those tables up-to-date:
`trafMon_SecurityProcs`.`Refresh_lowTraffic`(IN `_DBname` VARCHAR(20))
see above
`trafMon_SecurityProcs`.`Refresh_ExternInPeaks`(IN `_DBname` VARCHAR(20))
see above
One routine, called once per investigation, prepares a temporary table that supports the scanners related analysis:
`trafMon_SecurityProcs`.`Prepare_for_securityScanners`(_DBname, _maxPkts, _maxBytes)
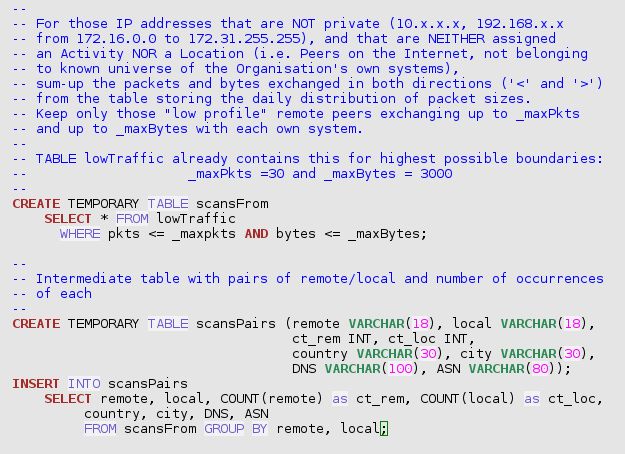
`trafMon_SecurityProcs`.`Top_Scanners`(_DBname, _maxPkts, _maxBytes, _topN)
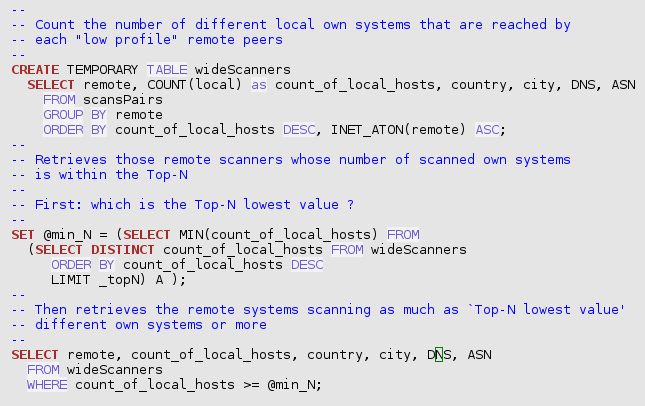
`trafMon_SecurityProcs`.`Top_Scanned`(_DBname, _maxPkts, _maxBytes, _topN)
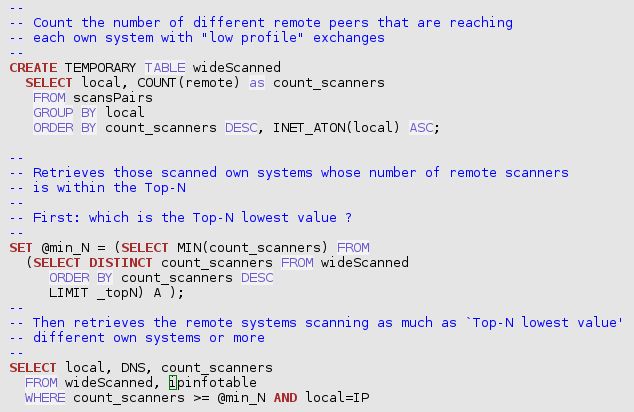
`trafMon_SecurityProcs`.`Top_ActiveScanners`(_DBname, _maxPkts, _maxBytes, _topN)

`trafMon_SecurityProcs`.`TopJumps_DailyPeak`(_DBname, _maxPkts, _maxBytes, _topN)

And, in order to further identify the cause of a jump in traffic volume towards a given own system, the following query is meaningful:
`trafMon_SecurityProcs`.`Top_IngressTo`(_DBname, _Date, _Local, _topN)

4 Drawing a Sample BIRT Report Template
We take party of this illustrative tutorial on security auditing examples and, in particular, on the above presented set of stored procedures extracting the Top-N most significant patterns, to give a practical example on how to create your own BIRT report template based on trafMon collected observations.
4.1 BIRT Designer Setup
- Download and install the BIRT Designer: preferably within Eclipse, to have a workspace with the trafMon project and its tree structure with the report templates and subdirectories.
- Copy the hierarchy of all “.rptdesign” files and its sub-directories Library/ and Scripts/ from the trafMon software distribution package.
- Create a new report called “SecuritySynthesis.rptdesign”.
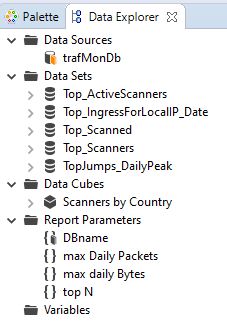
- In the Resource Explorer, drag the Shared Resources/Library/trafMonDb.rptlibrary/Data Sources/trafmonDb to the Data Explorer Data Sources. This defines the connection to the database.
- In the Resource Explorer, drag the Shared Resources/Library/trafMonDb.rptlibrary/Report Parameters/DBname to the Data Explorer Report Parameters.
- In the Data Explorer, add three additional Report Parameters: “max Daily Packets” (Integer, default 20), “max Daily Bytes” (Integer, default 2000) and “top N” (Integer default 5).
4.2 Data Sets from Stored Procedures
Create a Data Set “Top_ActiveScanners” with the sole available Data Source.
- Query: CALL trafMon_SecurityProcs.Top_ActiveScanners(‘trafMon’, 10, 1000, 5)
- Property Binding:
“CALL `trafMon_SecurityProcs`.`Top_ActiveScanners`(‘”+params[“DBname”].value+”‘,”+params[“max Daily Packets”].value+”,”+params[“max daily Bytes”].value+”,”+params[“top N”].value+”)”
Create a Data Set “Top_Scanners” with the sole available Data Source.
- Query: CALL trafMon_SecurityProcs.Top_Scanners(‘trafMon’, 10, 1000, 5)
- Property Binding:
“CALL `trafMon_SecurityProcs`.`Top_Scanners`(‘”+params[“DBname”].value+”‘,”+params[“max Daily Packets”].value+”,”+params[“max daily Bytes”].value+”,”+params[“top N”].value+”)”
Create a Data Set “Top_Scanned” with the sole available Data Source.
- Query: CALL trafMon_SecurityProcs.Top_Scanned(‘trafMon’, 10, 1000, 5)
- Property Binding:
“CALL `trafMon_SecurityProcs`.`Top_Scanned`(‘”+params[“DBname”].value+”‘,”+params[“max Daily Packets”].value+”,”+params[“max daily Bytes”].value+”,”+params[“top N”].value+”)”
Create a Data Set “TopJumps_DailyPeak” with the sole available Data Source.
- Query: CALL trafMon_SecurityProcs.TopJumps_DailyPeak(‘trafMon’)
- Property Binding:
“CALL `trafMon_SecurityProcs`.`TopJumps_DailyPeak`(‘”+params[“DBname”].value+”)”
Create a Data Set “Top_IngressForLocalIP_Date” with the sole available Data Source.
- Query: CALL trafMon_SecurityProcs.Top_IngressTo(?, ?, ?, ?)
- Parameters:
- db, String, Linked to Report Parameter DBname
- peakDate, String, Default Value 2017-07-12 00:00:00
- peakLocalIP, String, Default Value 141.253.12.3
- topN , Integer, Linked to Report Parameter top N
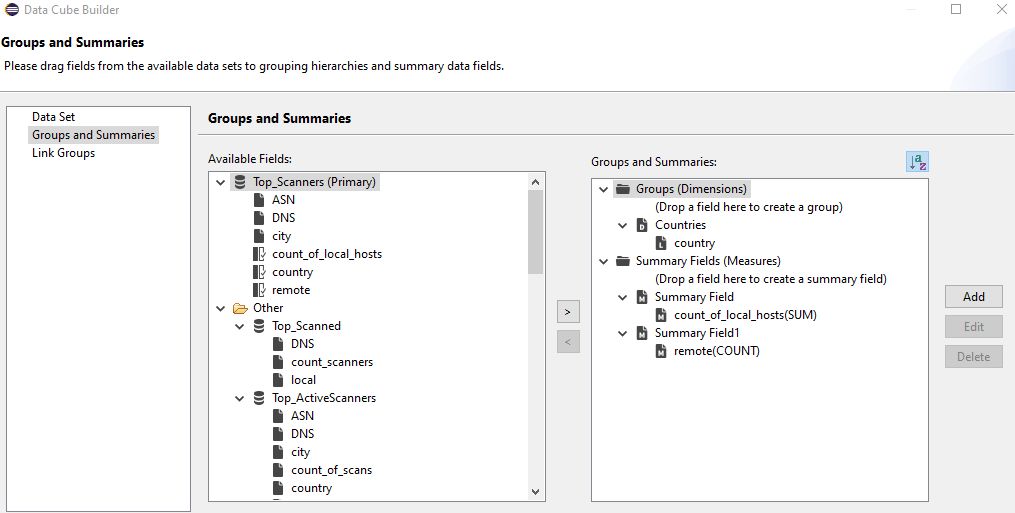
Create a Data Cube “Scanners by Country” with Primary dataset: Top_Scanners
- Drag country to Groups (Dimensions)
- Drag count_of_local_hosts to Summary Fields (Measures)
- Drag remote to Summary Fields (Measures)
4.3 Drawing the Structure of the Report
Warning: explicit dimensions (using units like cm or in) as well as adjusting sizes with mouse dragging do never have the expected effect.
First, the effect on the pseudo WYSIWYG Designer view is often surprising.
But more importantly, the actual generated report does not respect the intended sizes.
In addition, there is always this difference in character sizes when mapping fonts between Linux (X Windows) and Microsoft Windows.
The Best is always to dimension everything as explicit percentage. And this must be exhaustive: do not leave the width of the last column empty (supposing it will occupy the rest of the percentage); but assign its percentage width explicitly, in such a way to correctly reach 100% by summing all elements widths.
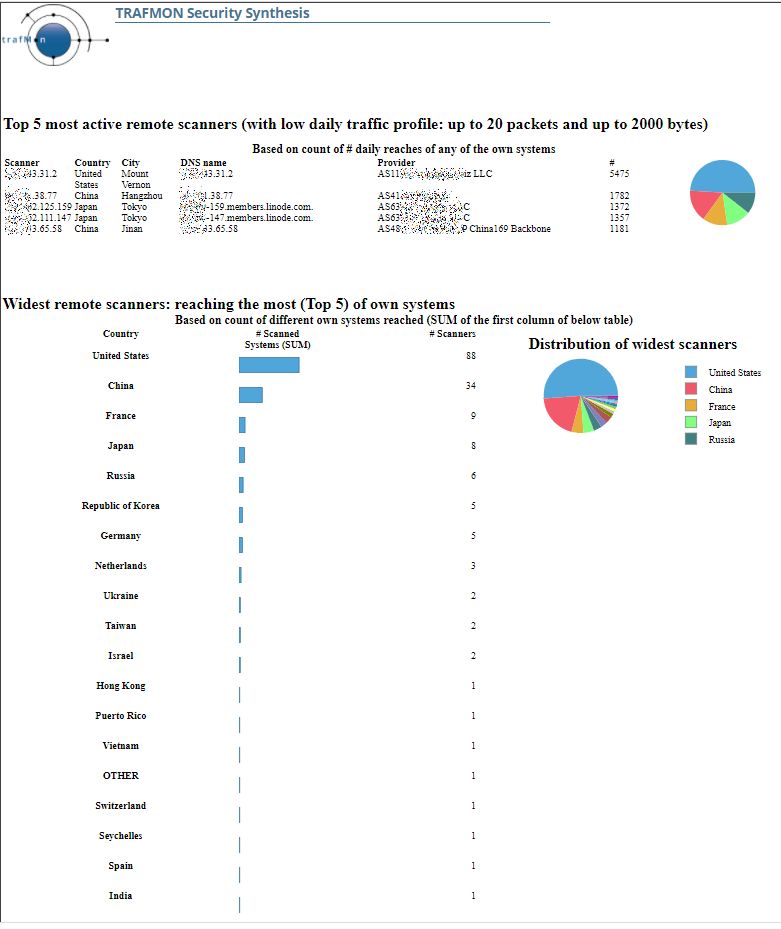
Create a Grid with 1 column and 6 rows: these are the main sections of your report.
- In the top row cell, create a Grid with 1 column and 3 rows
- In the top row cell, create a Dynamic Text (Bold 16):
"Top "+params["top N"].value.toString()+" most active remote scanners (with low daily traffic profile: up to "
 +params["max Daily Packets"].value+" packets and up to "+params["max daily Bytes"].value+" bytes)"
-
- In the mid row cell, create a Text (centered Bold 12): Based on count of # daily reaches of any of the own systems
- In the bottom row cell, create a Grid with 2 columns and 1 row
- In the left cell (80% width), drag the Data Set Top_ActiveScanners. Reorder the columns, adapt their labels. Assign percentage width (12, 8, 10, 30, 34, 6)

-
-
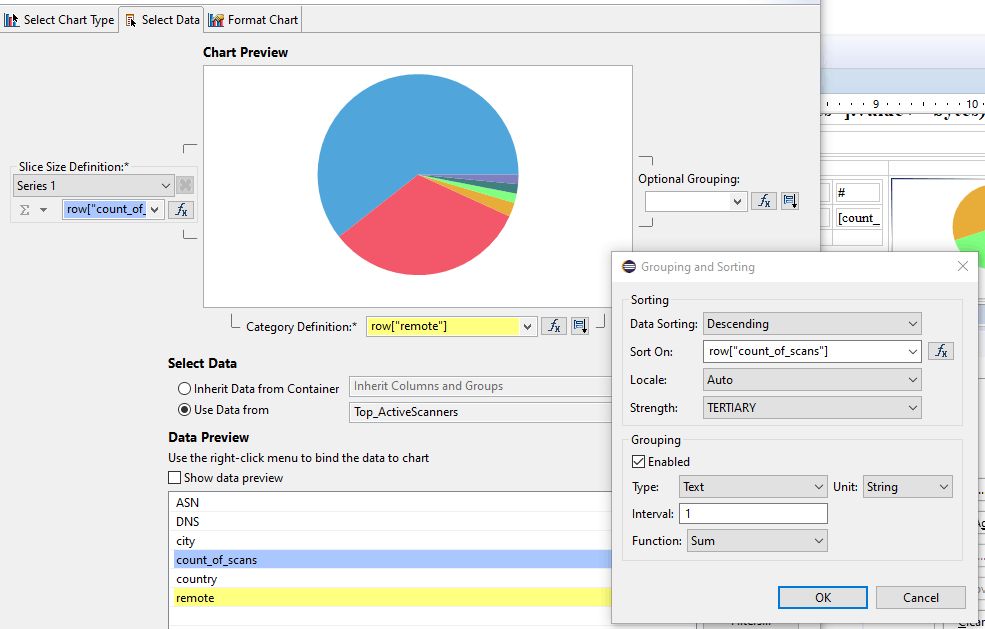
- In the right cell (20% width), create a pie chart. Use data from: TopActiveScanners. Drag count_of_scans as Slice Size Definition (Series 1 – on the left of the pie). Drag remote as Category Definition (below the pie) and specify Descending Sorting. In the Format Chart, suppress visibility for title and Legend, and remove the title of Value Series in the Series tab.
-
- In the 2nd row cell, create a Dynamic Text (Bold 16):
"Widest remote scanners: reaching the most (Top "+params["top N"].value.toString()+") of own systems"
- In the 3rd row cell, create a Text (centered Bold 12): Based on count of different own systems reached (SUM of the first column of below table)
- In the 4th row cell, create a Grid with 1 column and 2 rows
- In the top row, create a Grid with 2 column and 1 row
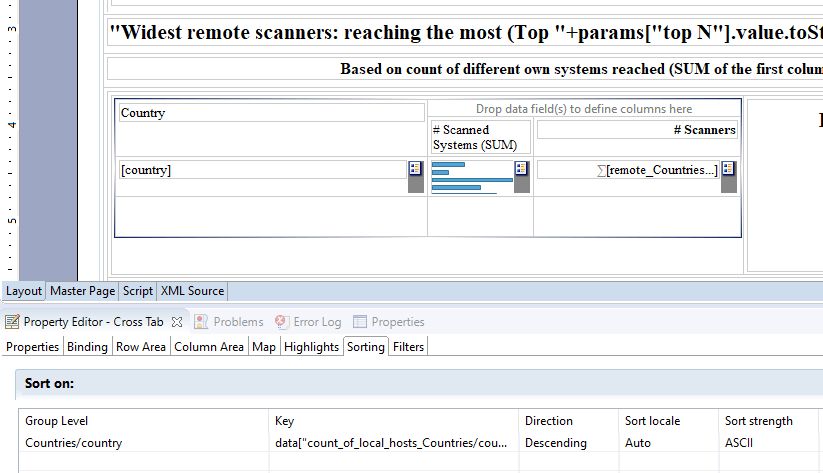
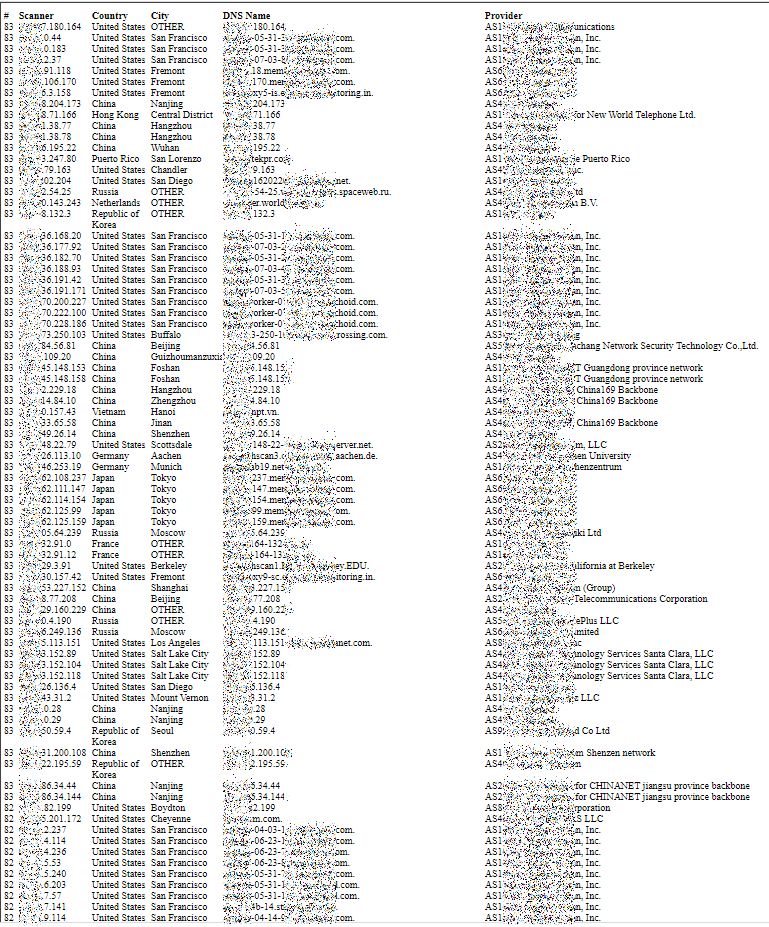
- In the first columns (60%), drag the Data Cube Scanners by Country. Rename and re-style the columns labels (Country, #Scanned Systems (SUM), # Scanners). Select the Chart option for the 2nd column. Delete the Footer of this 2nd column. Select the entire Cross Tab and, in the below Property Editor, used the Sorting tab to add a Descending sort for data[“count_of_local_hosts_Countries/country”].
- In the top row, create a Grid with 2 column and 1 row
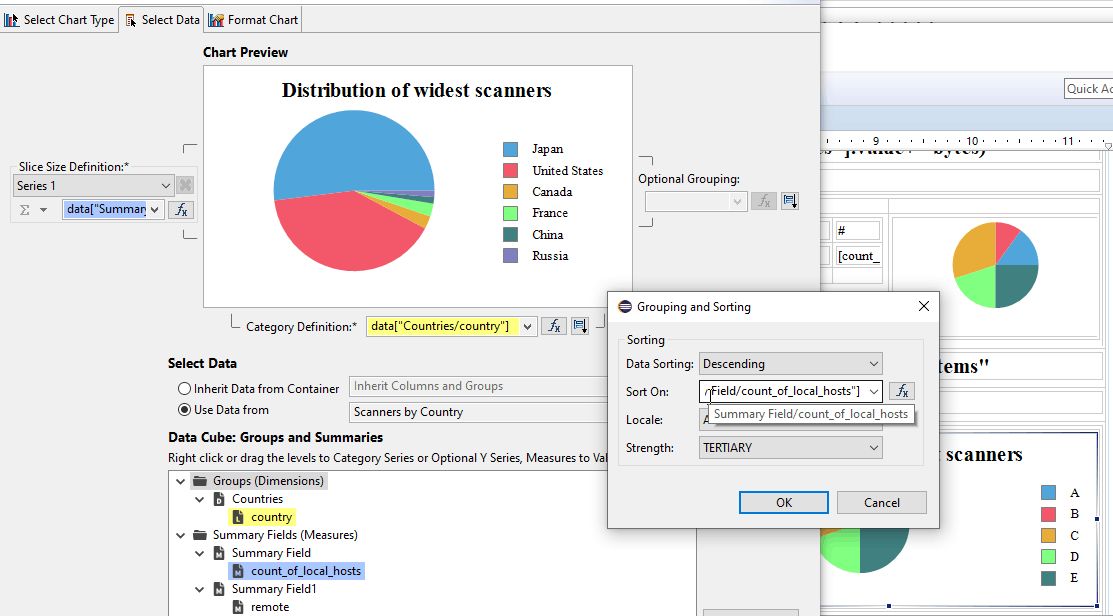
- In the 2nd column (40%), create a pie chart with Use Data From Scanners by Country. Drag the field count_of_local_hosts to the Slice Size definitions / Series 1. Drag the field country to the Category Definition and define a Descending Sorting on count_of_local_hosts. Then, in Format Chart tab, specify a Title, let the Legend be visible and, in Series, remove the Title of Value Series.
- In the 5th row cell, create a Grid with 1 column and 2 rows
- In the top row, create a Grid with 2 column and 1 row
- In the top row cell, create a Dynamic Text (Bold 16):
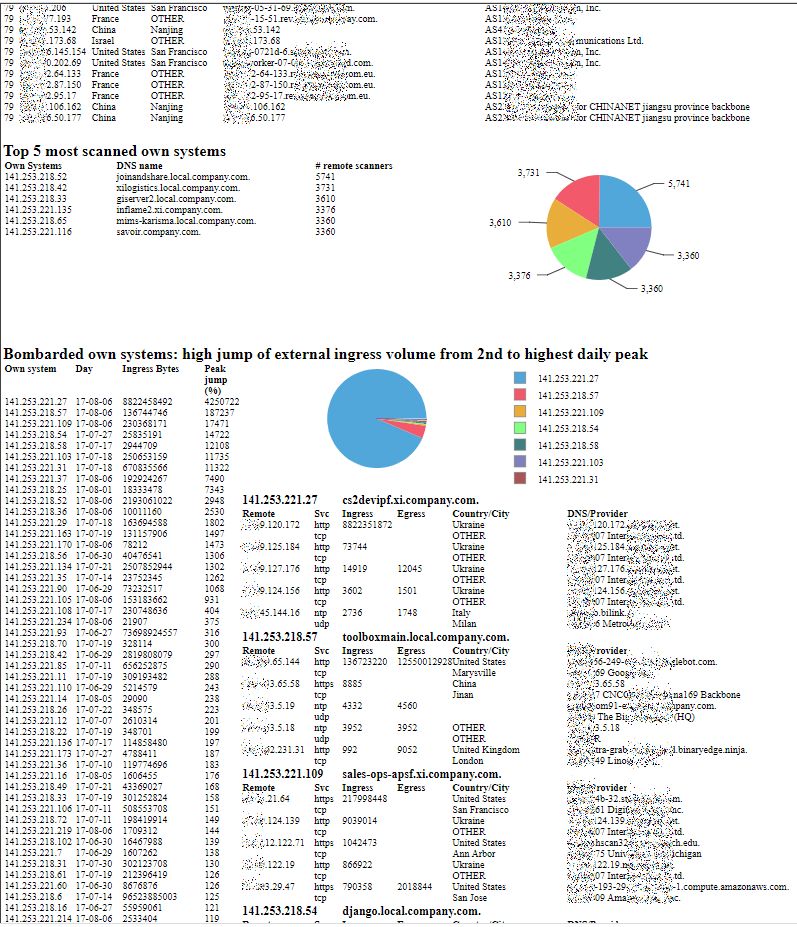
"Top "+params["top N"].value.toString()+" most scanned own systems"
- In the bottom row cell, create a Grid with 2 columns and 1 row
- In the left cell (50%), drag the Data Set Top_Scanned, adjust the column widths (28, 50 and 22 %). Re-label and re-style the headings (Own Systems, DNS name, # remote scanners).
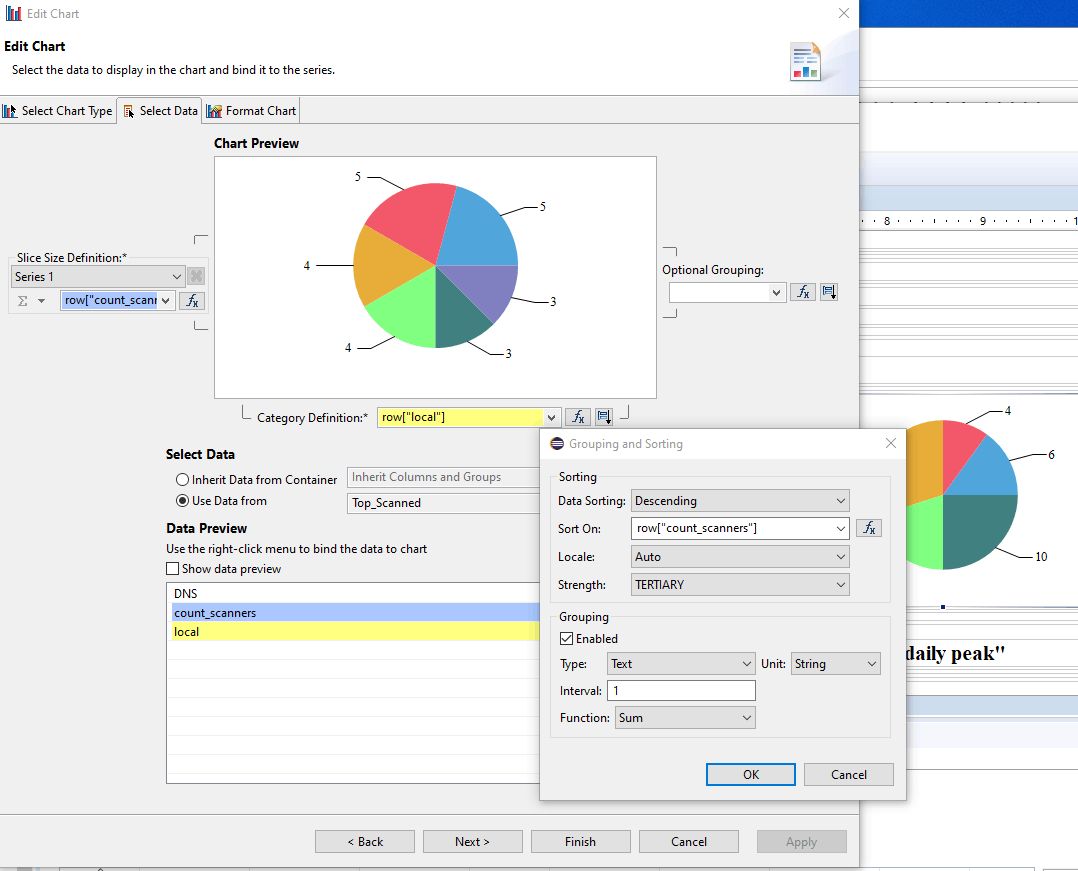
- In the right cell (50%), create a pie chart that Use Data From Top_Scanned. Drag the field count_scanners to Slice Size Definition / Series 1. Drag the field local to Category Definition, and select Sorting Descending on row[“count_scanners”]. In Format Chart tab, suppress visibility of Title and of Legend; in Series, remove the Title for Value Series. Select Value Series and activate the check box Show Series Label.
- In the top row, create a Grid with 2 column and 1 row
- In the 6th row cell, create a Grid with 1 column and 2 rows
- In the top row, create a Grid with 2 column and 1 row
- In the top row cell, create a Dynamic Text (Bold 16):
"Bombarded own systems: high jump of external ingress volume from 2nd to highest daily peak"
- In the bottom row cell, create a Grid with 2 columns and 1 row
- In the left cell (30%), drag the Data Set TopJumps_DailyPeak, adjust the column widths (30, 20, 35 and 15 %). Re-label and re-style the headings (Own System, Day, Ingress Bytes, Peak jump (%)).
- In the right cell (60%), create a Grid with 1 column and 2 rows
- In the top row cell, create a pie chart that Use Data From TopJumps_DailyPeak. Drag the field jump_pct to Slice Size Definition / Series 1. Drag the field local to Category Definition, and select Sorting Descending on row[“jump_pct”]. In Format Chart tab, suppress visibility of Title but keep visibility of Legend; in Series, remove the Title for Value Series.
- In the bottom row, create a List for Data Set TopJumps_DailyPeak. Keep the fields local, rangestart (the day of the top peak) and jump_pct. In the below Property Editor, in Sorting tab, sort Descending on row[“jump_pct”] . In the below Property Editor, in Filters tab, Expression row[“jump_pct”] Operator Top n, Value 1 params[“top N”].value — there will be as much elements (tables) in the list as specified by the value assigned to the top N parameter of the report. Leave the Header and Footer empty.
- In the Detail, drag the Data Set Top_IngressForLocalIP_Date. In the below Property Editor, Binding tab: assign the DataSet Parameter Binding as
- db is params[“DBname”].value
- peakDate is row[“rangestart”]
- peakLocalIP is row[“local”]
- topN is params[“top N”].value
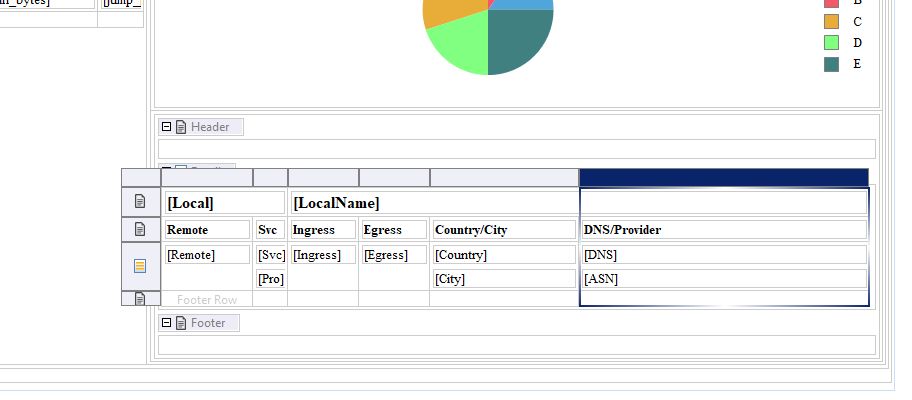
- Then re-organise the table:
- Select the Heading row and insert one row above.
- Move [Local] in first heading row, first column, and delete Local label.
- Move [LocalName] in first heading row, third column, and delete LocalName label.
- Move [Remote] and Remote label to first column.
- Move [Svc] and Svc label to second column.
- Move [Pro] on top of [Svc] (at right side): it goes to a new row, below the target; and delete Pro label.
- Move [Ingress] and Ingress label to third column (below [LocalName]).
- Move [City] below [Country].
- Move [ASN] below [DNS].
- Delete the useless columns.
- Rename and re-style the heading labels: Remote, Svc, Ingress, Egress Country/City, DNS/Provider (respectively 13, 5, 10, 10, 31 and 41 % width).
- In the top row, create a Grid with 2 column and 1 row
4.4 Installing and Executing the New Report
You can now copy your SecuritySynthesis.rptdesign report template to /var/lib/tomcat/webapps/birt/trafMon_reports/
# chown tomcat /var/lib/tomcat/webapps/birt/trafMon_reports/SecuritySynthesis.rptdesign
Then invoke it via the URL (supposedly your Tomcat installation is reached via http://localhost:8080/):
http://localhost:8080/birt/run?__report=trafMon_reports/SecuritySynthesis.rptdesign
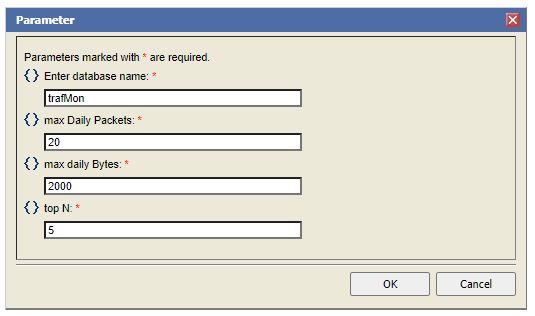
This will pop-up a form querying values for the four report parameters
This tutorial page can also be downloaded as a document: Use Case 3: Security Auditing, and the example MySQL stored procedures and resulting BIRT report template file are provided as a separate downloadable package
The tutorial is accompanied by an SQL file and a BIRT report template and published as a supplementary package downloadable from the Download page of this web site.
Executing the given sql file
mysql -c < trafMon_SecurityProcs.sql
stores the procedures in a database schema named trafMon_SecurityProcs.
The BIRT report template (SecuritySynthesis.rptdesign) must be copied to the same runtime location(s) where the prepared reports of the standard trafMon distribution are stored (typically /var/lib/tomcat/webapps/birt/trafMon_reports/ and /opt/trafMon/trafMon_reports/).
To execute, use a URL like http:localost:8080/birt/run?report=__report=trafMon_reports/SecuritySynthesis.rptdesign
