


Agentless measurements
No agents have to deployed through-out the network in order collect raw data for aggregation and reporting. The data collection is based on passive probing and (optionally) the reception of Netflow records.
Fine-grained collection and reporting
The data collected allows to create weekly or monthly reports with a granularity down to 1 minute.
Raw observations could even be produced at finer granularity, down to 10 seconds, or logged individually, if necessary
Continuous data loading and aggregation in a relational database
Every 10 minutes or so, the recent chunk of gathered data logs are loaded and pre-aggregated in MySQL database tables
Detailed and rich reporting
The Eclipse BIRT based Report Writer provides an open and flexible environment for rich and detailed protocol measurements and network response time reports,
Network trunk calibration
trafMon provides the network operator good insides of the performance of the network, which allows network data-trunks calibration.
Network Troubleshooting
Through the use of the many per protocol ‘counter reports’ the operator has a powerful tool for troubleshooting and root cause analysis.
The tool’s Synthesis Reports allow the user to quickly identify applications, activities and/or locations that consume the most network resources.
Capacity Planning
Tracking of detailed historical performance can be used for service auditing and capacity planning.
Using the fully automated (batch) Data Aggregation (aggregation per minute, per hour and per day), higher level business reports can be automatically produced.
Multi Media monitoring
Using the extensible flow templates for gathering per-flow latency, packet loss and, possibly, jitter in a range of environments, is particularly useful for real-time media (Voice, Video) applications.
FTP sessions follow-up and File Transfer monitoring
For what concerns the monitoring of the use of FTP, individual users can be tracked in detailed and high-level reports.
Quick to deploy and maintain
Although the configuration can be very rich and complex, a full installation can be achieve in little time.
A percentage of coverage is presented with detailed views over a chosen time span, in order to permit Users to evaluate the representativeness of the shown figures.
Probe load saturation and other run-time processing issue events are recorded in the database and kept together with the historical measurements, in order to permit correct interpretation of abnormalities.
Run-time warning and errors in the data acquisition can be reflected in real-time network dashboard through the forwarding of SNMP Traps by the distributed probes and central collector.
The distributed probe components as well as the central collector have embedded SNMP agents reflecting ad hoc processing statistics.
Synthesis Reports
These summary reports permit to see the evolution and distribution of observed traffic volumes about known activities (e.g. Company departments) and/or locations (sites, or subnets or building rooms), between themselves as well as with remote geo-located countries over the Internet.
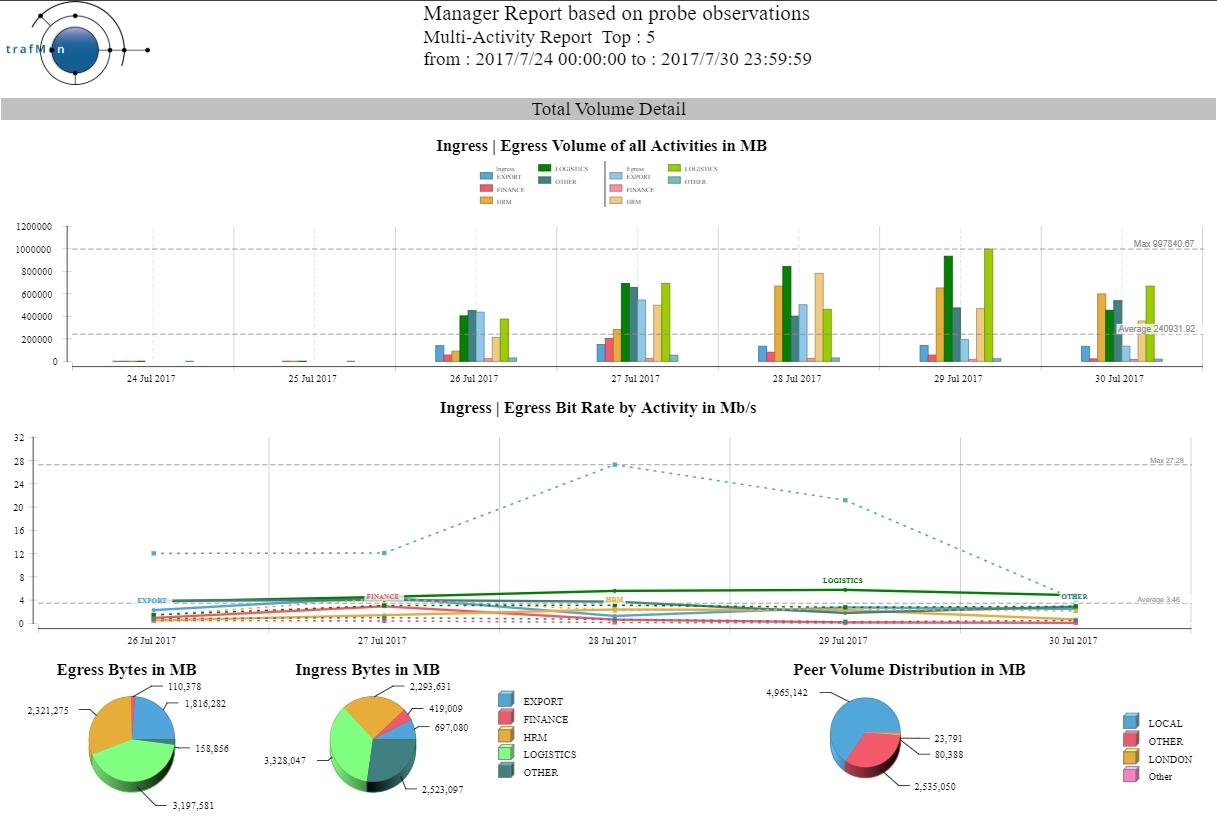
Manager Report – Probe(s)
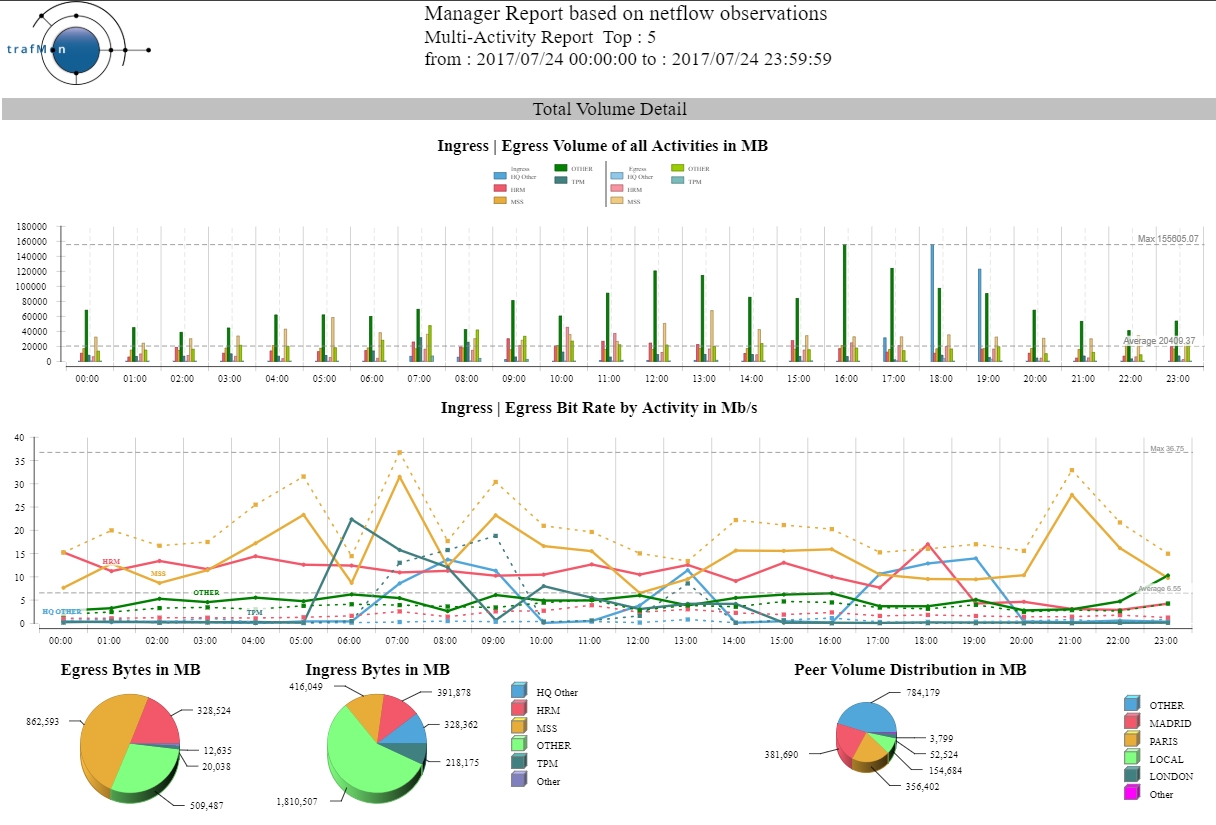
Manager Report – Netflow
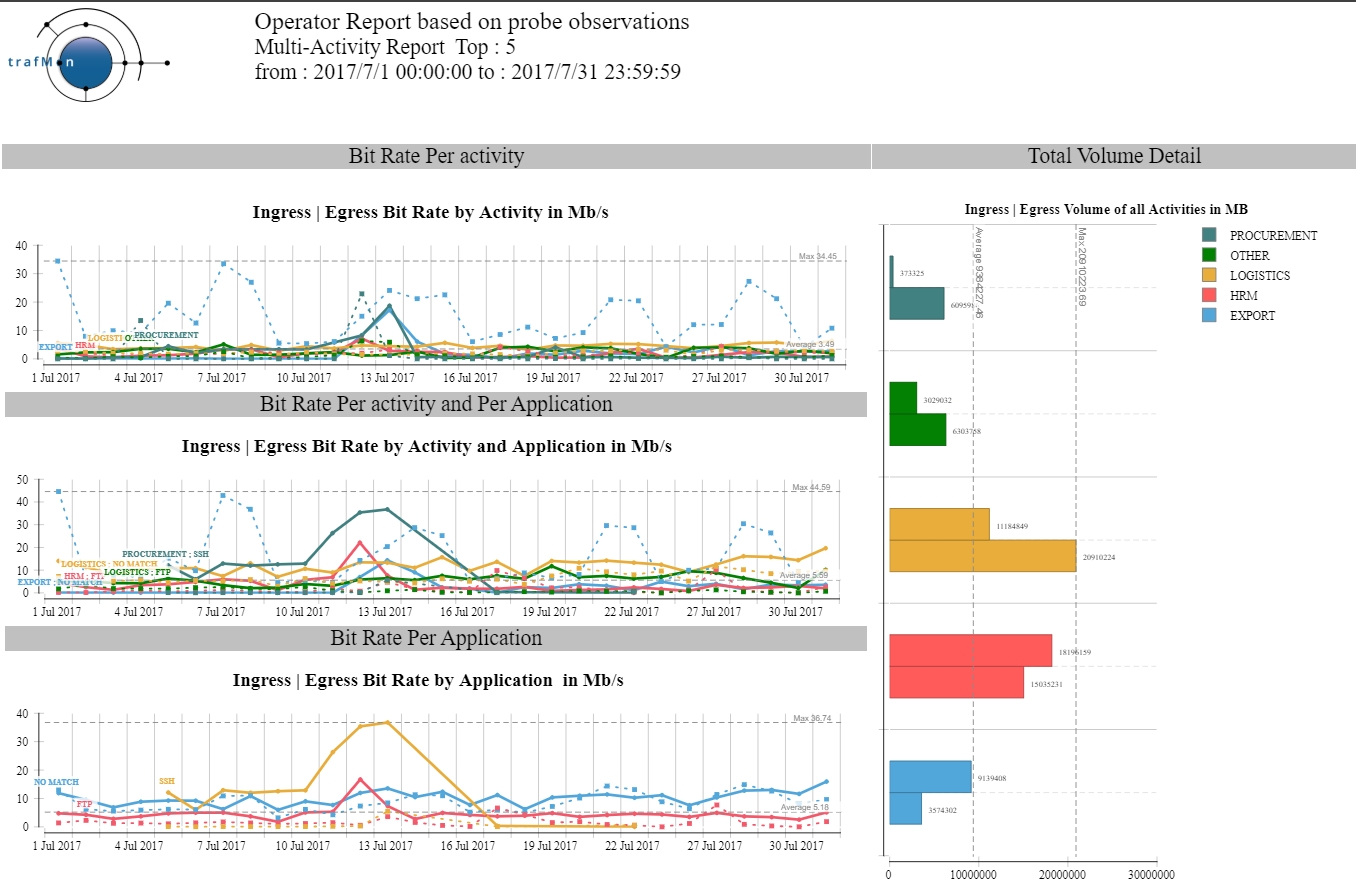
Operator Report
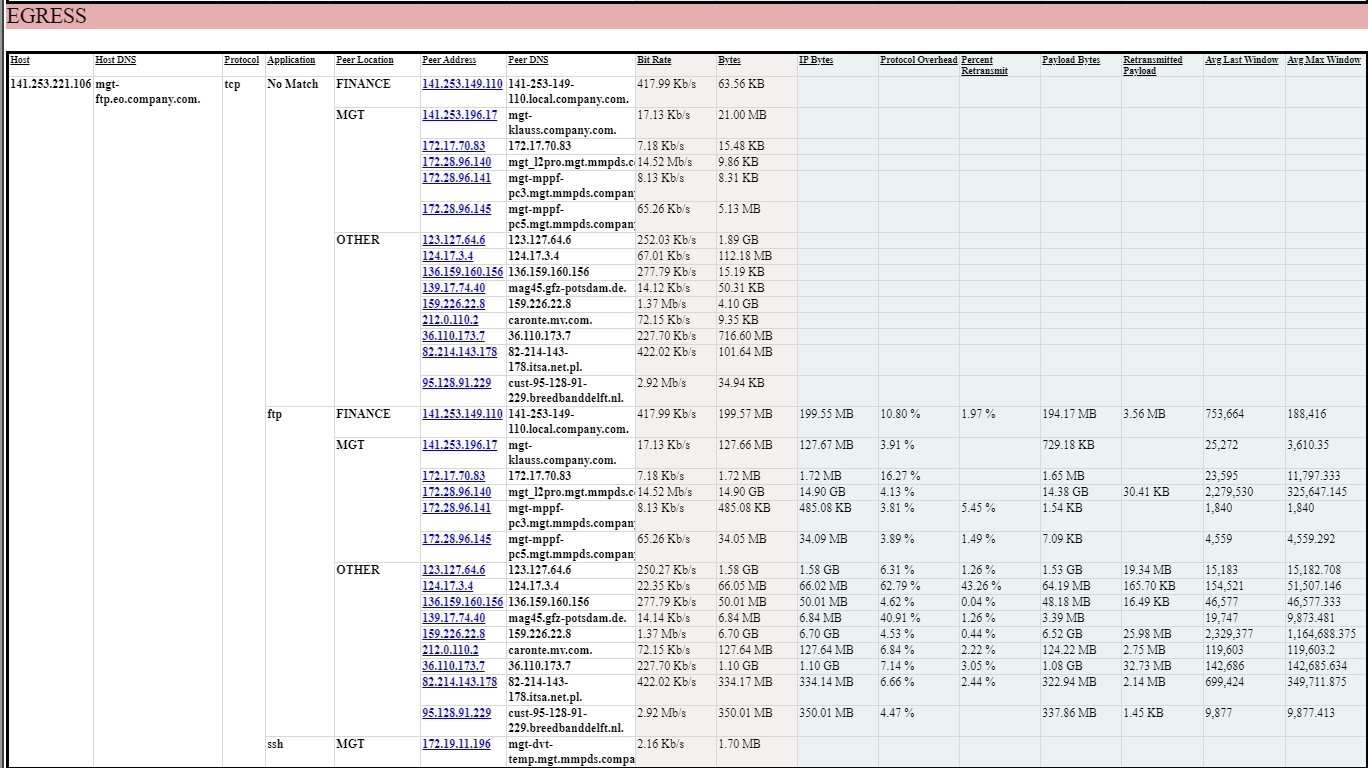
Operator Report Details
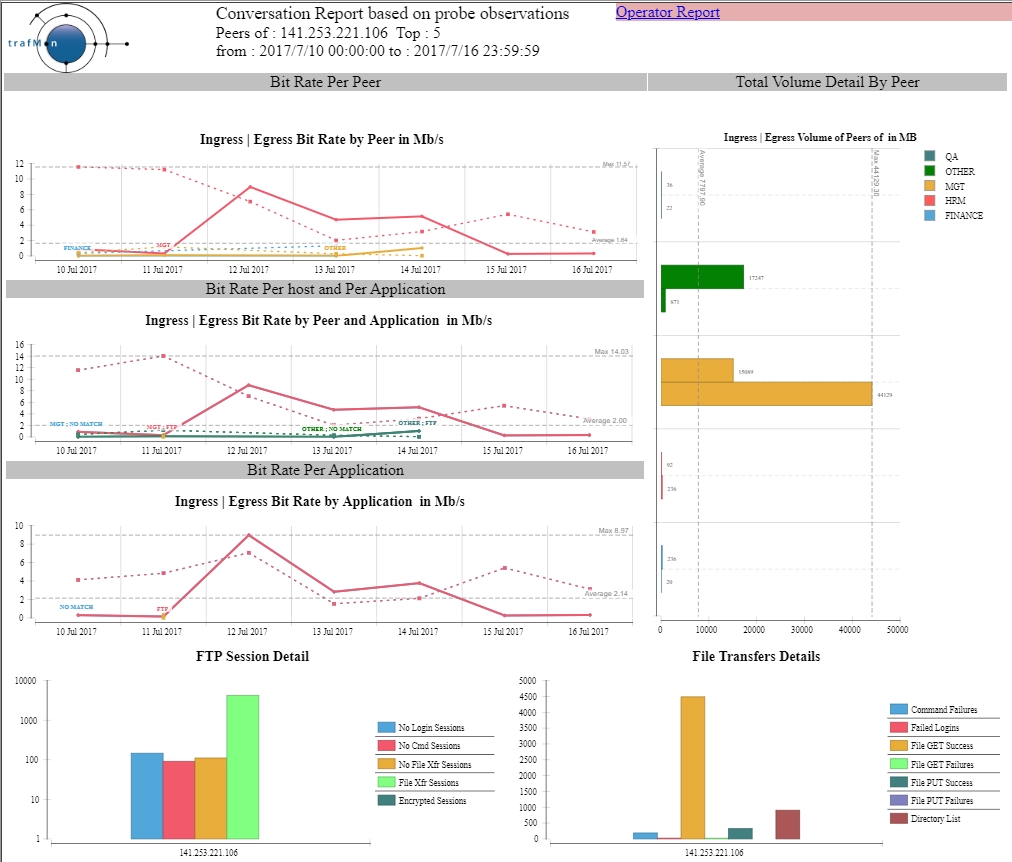
Conversations Report
Detailed Protocol Reports
These are existing examples of report layouts. Most are simply dumping the per-protocol basic observations pre-aggregated in the database at minute, hour and day granularity, in such a way that they can be further aggregated, with minimum, maximum and average over the available data (over only the non empty produced time slices), but also the average (real) and maximum (real) over the time selected grain.
But you can easily draw your own templates through the use of the Eclipse BIRT Designer tool, or any database reporting tool of your choice.
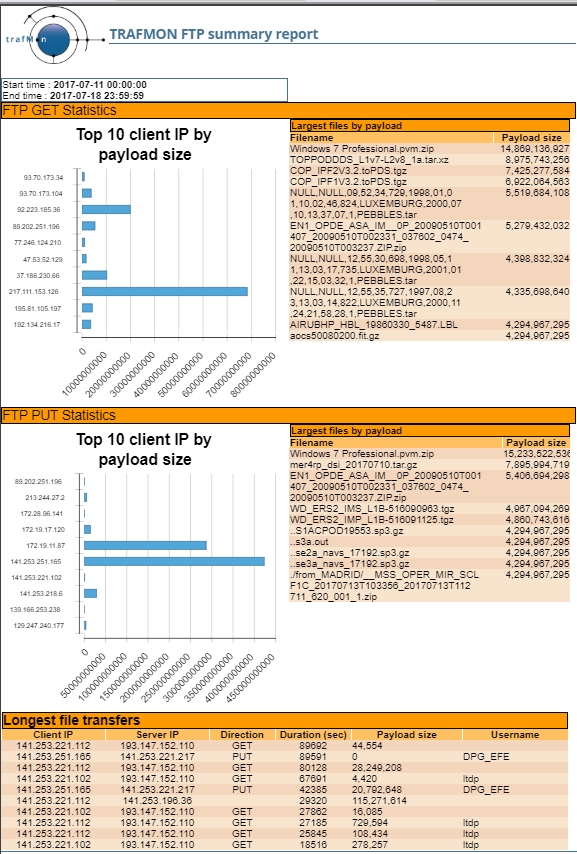
FTP Summary Report

One way Latency Report

FTP Details Report
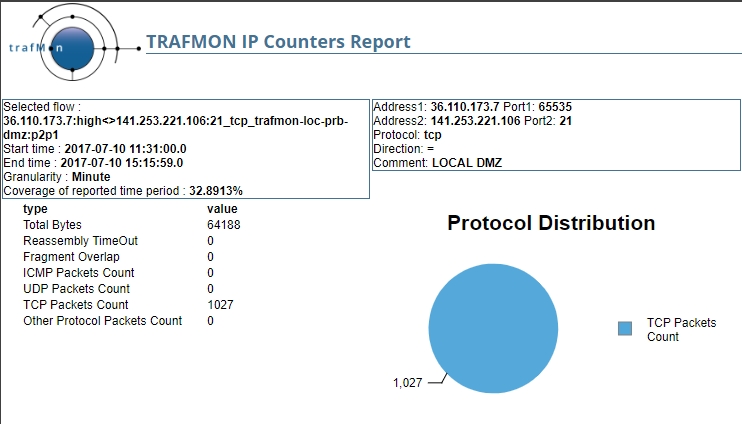
IP Counters Report

One way Counters Report
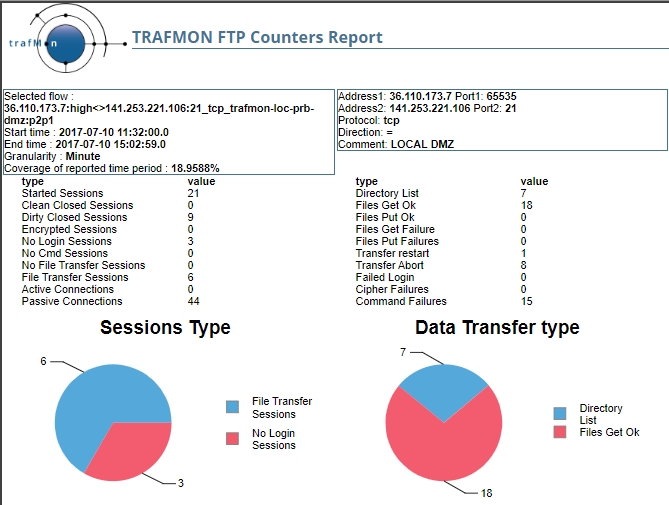
FTP Counters Report

IP Sizes Report
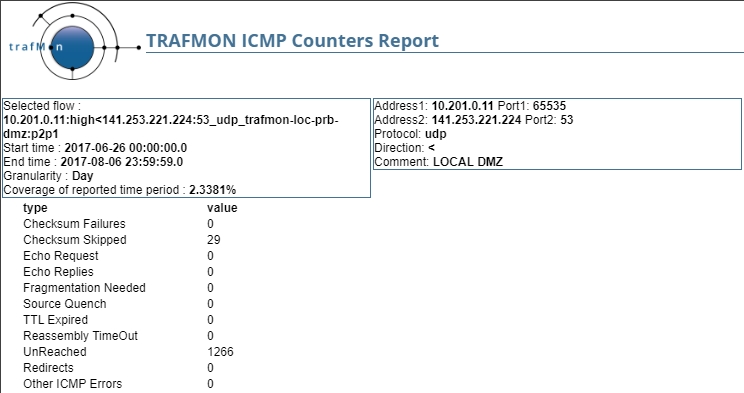
ICMP Counters Report
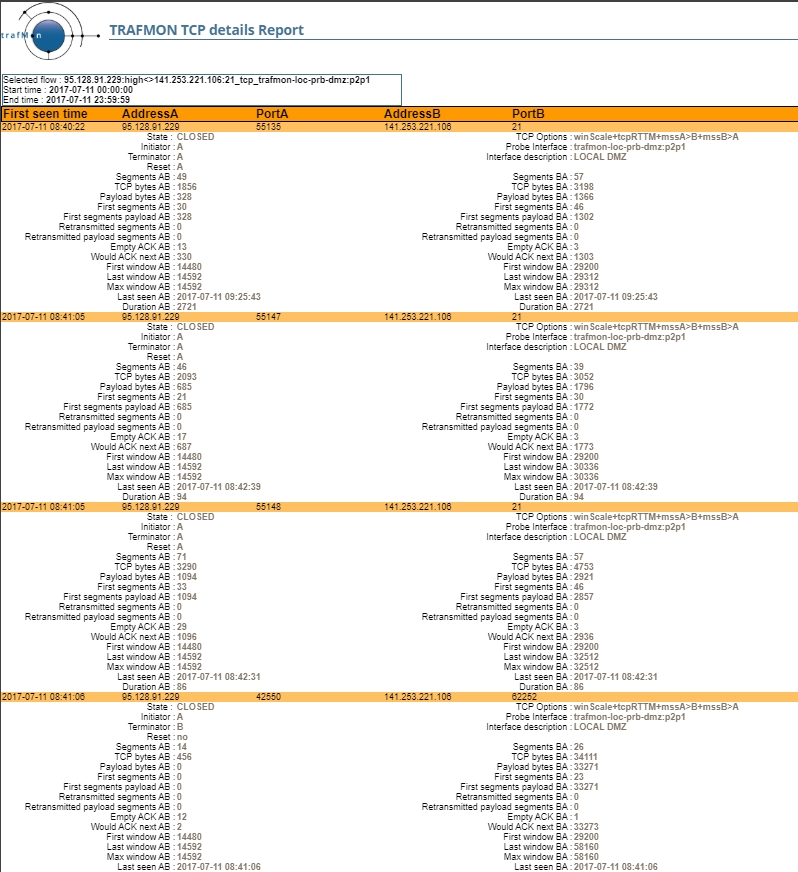
TCP Details Report

UDP Counters Report
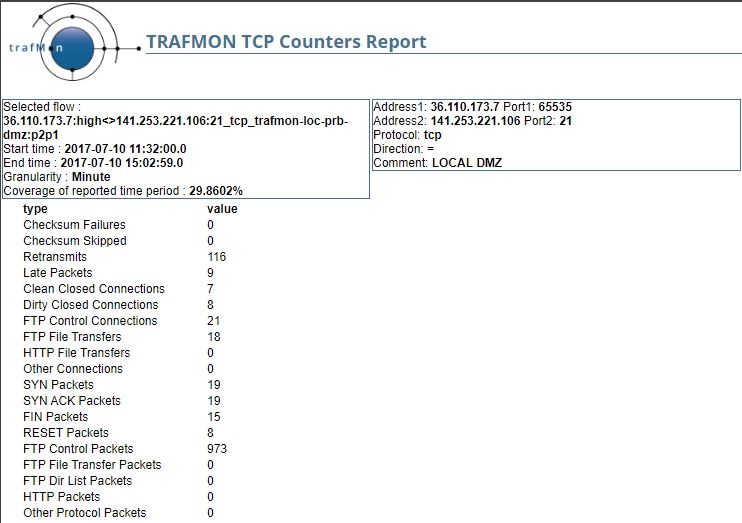
TCP Counters Report

Two way Delays Report